

It is a general rule that gold operates inversely in relation to the US Dollar. If the dollar is down, gold is up as other currencies are now stronger than the dollar and can therefore acquire more gold for the same cost – therefore this increases demand for gold; and visa-versa.
This means that you can get a reading on the direction that gold is likely to move in by monitoring for big moves in the forex markets - as forex moves precursor those in gold.
Get more free articles like this helping you learn how to trade online.
Whilst you can trade the dollar against any other currency, it’s predominantly traded against Euros (depicted as EUR/ USD) or British Pounds (GBP/ USD). For both currency pairs the exchange rate is stated as the value of one Euro or Pound against the US Dollar – i.e. GBP/ USD 1.6000 means that for every British Pound I hold it is worth 1.6000 US Dollars.
Gold acts like a currency in its own right and, as it’s priced in dollars, it makes sense to think of its “exchange rate” being that of its current price for an ounce of gold.
All exchange rates are linked – so if the current gold price (i.e. “gold’s exchange rate”) is $1600 per ounce and the exchange rate between the GBP/ USD is 1.6000 (keeping things simple) we can deduce that if I’m holding £10,000 then I can purchase 10 ounces of gold (£10,000 x 1.6000 = $16,000/ $1,600 = 10 ounces) . If the dollar weakens against the pound to a rate of GBP/ USD 2.0000 my £10,000 would now buy me 12.5 ounces of gold (£10,000 x 2.0000 = $20,000/ $1,600 = 12.5 ounces).
Because I can now buy more gold for the same amount of money it represents a better investment and so I’m all over it it…but so is everyone else who is holding £’s (or whichever currency has advanced against the $) and so very quickly the price of gold increases due to increased demand. Simple economics.
Irrespective of the direction - if there is a substantial change to the value of dollar it tends to result in an inverse impact to the price of gold and, as gold reacts to the dollar price, it passes through its own technical thresholds which exacerbate or limit the impact.
The following charts from 23rd November 2012 help illustrate this. Bear in mind that the 23rd Nov was supposed to be a quiet day trading as it was the Friday after Thanksgiving in the US and so is traditionally treated almost like a public holiday and therefore trading is very light. The first two charts are hourly EUR/ USD and GBP/ USD respectively:
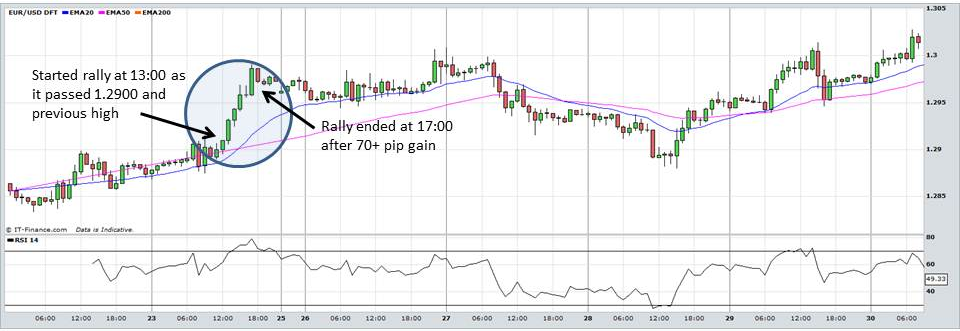
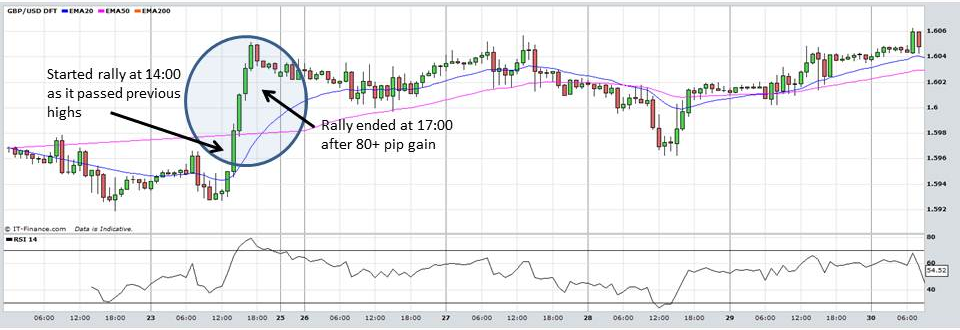
Both currency pairs advanced quickly against the dollar (as you can see from the charts it is very common that EUR and GBP move in similar patterns against USD) once they’d broken through resistance levels between 12pm to 2pm.
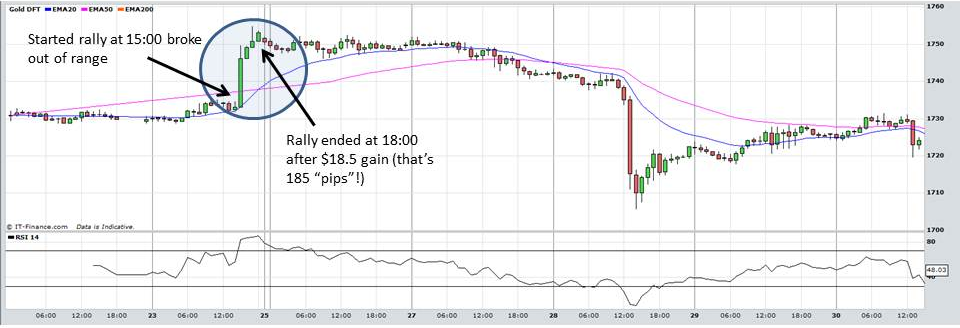
The chart above shows the hourly gold spot price on the same day. Notice how there was a very flat period prior to the rally starting – no-one was really expecting any movement in gold due to the US holidays. As EUR and GBP made substantial gains against USD the price of gold reacted and broke out of the fairly narrow range it had been trading in for the previous 3 weeks. In the preceding week it had been on an upwards trajectory, but couldn’t break through the 1736 level despite several tests and thus a triangle had formed as shown on the daily chart below:
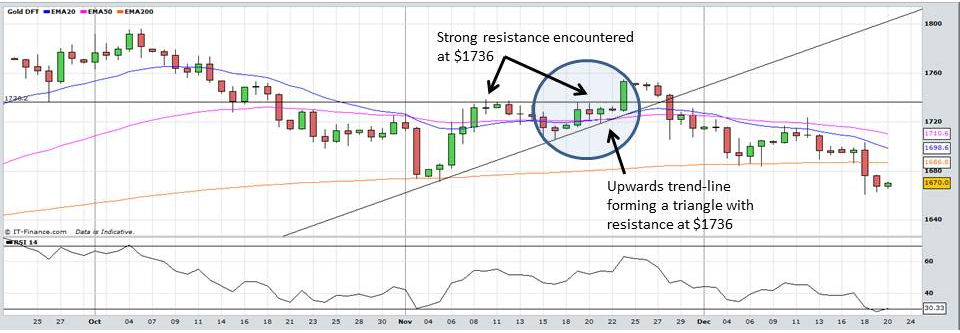
Usually in this chart pattern, when price breaks-out to the upside, it does so with some gusto and this was no different – the impact of a weaker dollar pushed the gold price through the resistance level at $1736 and helped to continue to drive it higher as stops were taken out and buy orders were triggered around 1740-1473. The rally in gold finished about 1 hour after both EUR and GBP rallies abated.
How can we use this in Gold Trading?
Like all indicators, it is not fool-proof and so shouldn’t be traded off of alone. We publish numerous articles explaining how external events impact the price of gold – the same rules apply to all and that is that these should be monitored and used to help guide your trading, but should not be the only determining factor.
You need to still be aware of the technical picture in gold itself – resistance & support levels, Fibonacci and Elliot Wave patterns, trendlines and moving averages will all play a part in exacerbating or limiting the impact of dollar-driven movements as we’ve highlighted above.
Having the EUR/ USD and GBP/ USD charts open throughout the day and monitoring for big movements should be a given. Make sure that you check them before making trading decisions – they can influence when you enter or exit, or when you move your stop loss.
When you see a strong movement in either direction which converges with a technical breakthrough on the gold chart, jump on it – more often than not it will work in your favour and usually with large gains to be made.
Our subscribers benefit from our insight and expertise being applied in real-time. Sign-up here for a FREE 2-Week Trial
Get more free articles like this helping you learn how to trade online.