
| We are predominantly technical traders, using a combination of Fibonacci Retracements, Elliot Wave Analysis and Japanese Candlesticks to help us predict where the gold price is moving to next. In this article we look at the main Candlestick patterns we use to spot price reversals and confirmations. First the basics: |  |
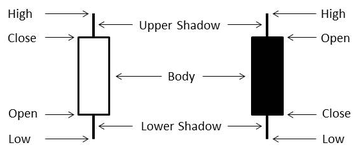
Each candlestick is composed of four values - high, low, open and close.
The body of the candlestick is the open and the close of the trading session (be that daily, hourly, 15 minutes, 1 minute, etc.). The high and the low of the session create the upper and lower shadows of the main candle body.
The body of the candlestick is the open and the close of the trading session (be that daily, hourly, 15 minutes, 1 minute, etc.). The high and the low of the session create the upper and lower shadows of the main candle body.
The candles are referred to as “White” which signifies a positive movement in price and “Black” which signifies a negative movement; although when these are displayed on charting packages they’re often shown as Green and Red.
Reversal Candlesticks & Patterns
The Hammer & Hangman The hangman and hammer consists of a small body (of either colour) with a very long lower or upper shadow. This pattern is typically found at the top or bottoms of trends. When the pattern occurs at the top of an up-trend it is called a hangman, when it is found at the bottom of a down trend it is called a hammer. | 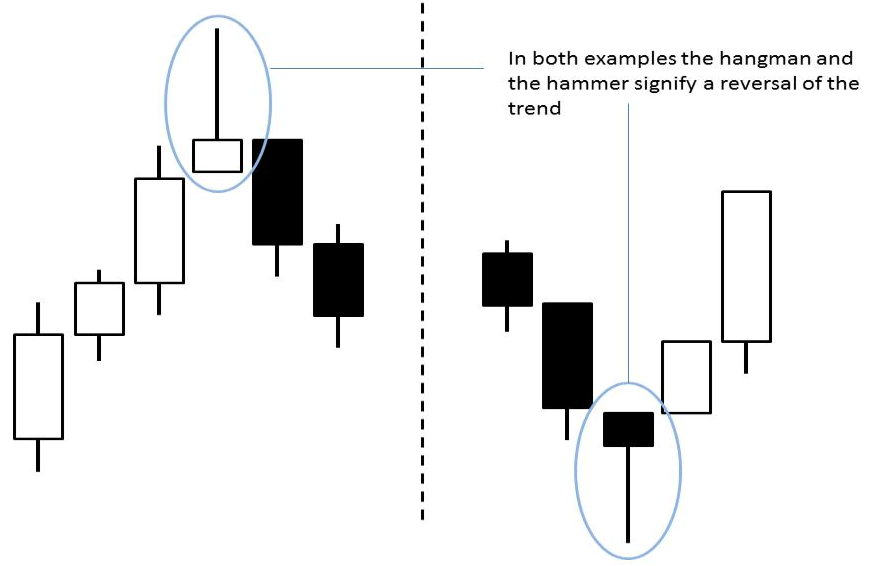 |
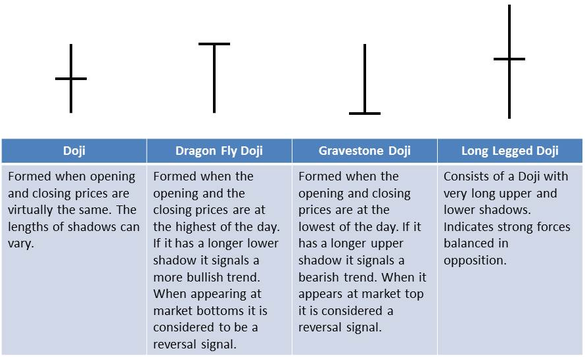
Doji's
This candle has no body - the open and the close is identical. There are variations of the Doji, but generally they indicate indecision in the market and that the trend may have run its course.
Sansen / Three Rivers / Three River Evening Star
This is a three day pattern indicating a bearish reversal. It always begins with a long white candle and always ends with a long black candle which must close within the body of the first session’s candle.
The second session candle can be black or white. It is small in form (hence the star) and it gaps above the close (i.e. it opens higher than the previous close) of the first candle.
This is considered a strong reversal signal when it appears at the top of an up-trend
The second session candle can be black or white. It is small in form (hence the star) and it gaps above the close (i.e. it opens higher than the previous close) of the first candle.
This is considered a strong reversal signal when it appears at the top of an up-trend
Sansen / Three Rivers / Three River Morning Star This is the bullish reversal equivalent to the Three River Evening Star, and the same rules apply (in reverse of course!) |  |
Evening / Morning Doji Stars
| The same principles apply as both the Evening and Morning Stars above (i.e. second candle must gap up/ down and the third candle must close within the body of the first). Doji Stars are an even greater signal of a reversal given that the second candle is replaced with a Doji which, in itself, is a strong indicator of a reversal. | 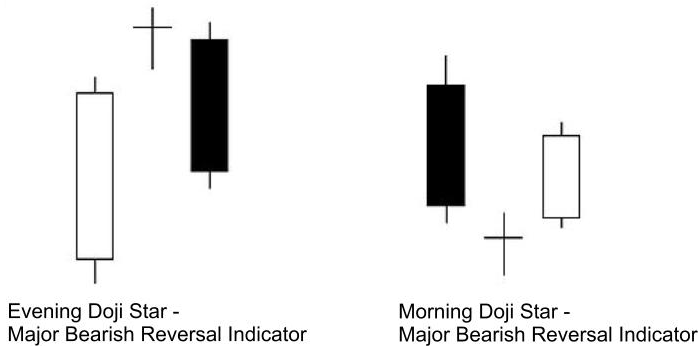 |
Confirmation / Continuation Patterns
Bearish Sanpei or Three Crows
This consists of three black candlesticks of similar sizes, with consecutively lower closes and the close of each candle is near to or at its low.
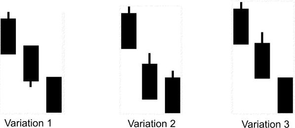
There can be slight variations between these, such as the next session opening slightly higher (gapping up) than the close of the previous session.
It doesn’t matter too much – so long as the candlesticks are of similar size and continues to make lower lows it indicates that there is a continuation of the trend.
It doesn’t matter too much – so long as the candlesticks are of similar size and continues to make lower lows it indicates that there is a continuation of the trend.
Each session opening at the close of its predecessor, and the candles being long in length, indicates a strong down-trend.
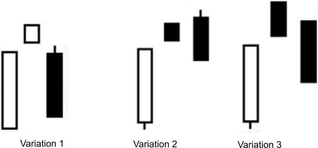
Bullish Sanpei or Three Soldiers
Similar to the Three Crows, the Bullish Sanpei or Three Soldiers consists of three consecutive white candles which are of similar size and which make higher highs whilst closing near to or at their high.
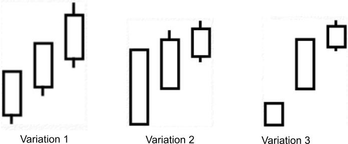
Again, there are variations to the patterns where gapping up or down between sessions is acceptable, so long as the candles continue to close higher than the previous high.
Each session opening at the close of its predecessor and the candles being long in length, indicates a strong up-trend.
Each session opening at the close of its predecessor and the candles being long in length, indicates a strong up-trend.
If the second and third session show decreasing higher high's following a long white candle in the first session (as per Variation 2 above), it signifies that the trend is reaching its end and to watch for a reversal.
If the sanpei is started by a small white candle, followed by a long white candle and then a small bodied white candle (as per Variation 3 above), this indicates uncertainty and a possible reversal.
When any variation of this occurs following a bottom, it is confirmation that a reversal is in.
If the sanpei is started by a small white candle, followed by a long white candle and then a small bodied white candle (as per Variation 3 above), this indicates uncertainty and a possible reversal.
When any variation of this occurs following a bottom, it is confirmation that a reversal is in.
Sanpo's or Three Methods
This pattern reflects that price rarely moves straight up or down – there is a level of retracement before the movement goes on to a new high or low.
Bearish Sanpo 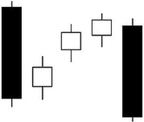 The three white candle bodies are contained within the range of first black body. This is considered as a bearish continuation pattern. | Bullish Sanpo 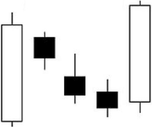 If the three black candle bodies are contained within the range of the first white body it is considered an indication of a bullish continuation pattern. |
We rarely use Candlesticks on their own to execute a trade - we look for confluence with other indicators such as Fibonacci Retracement levels, natural support or resistance levels and trend line breaks. However, the patterns above can give you a real clear indication that something is about to happen.
We hope you have found this article useful! Read more from our "How to Trade Online" series here...
We hope you have found this article useful! Read more from our "How to Trade Online" series here...