| | In this article we use an example from November 2012 to help explain an interesting relationship between the cost of gold lease rates and the spot gold price, and how this might be used for trading gold online. When the lease rates for gold are reduced sharply over a 2 or 3 day period the price of gold tends to also drops quickly – what’s really interesting is that the gold sell-off takes place a day or two after the reduction in the lease rates and therefore it is possible to use these sharp lease rate reductions as forward indicators of price action. |
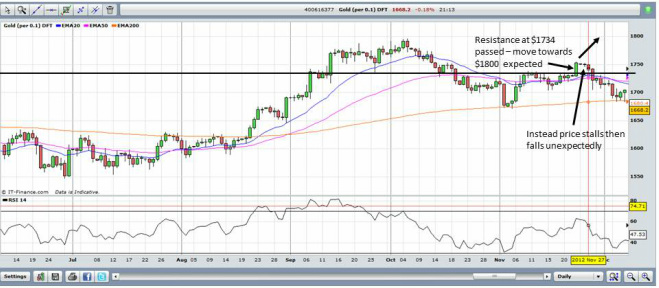
After a number of failed attempts to break through $1734 throughout November, gold finally punched its way through on the 23rd, triggering many technical buys as traders foresaw prices rising back towards the $1785-$1795 level. It came as a surprise to most of us when the price stalled out around $1755 and then fell away sharply on the 27th back down to $1700 and, later, to $1683.
So what caused the price to drop so suddenly?

Central banks lease their gold to provide liquidity. The Central bank will lease their gold to a bullion bank at the agreed GLR for a set duration (1, 3, 6 or 12 months) – the bullion bank uses the gold to create a profit by selling the gold and using the money to invest in something which yields higher returns, using these returns to pay off the lease costs on the gold.
Since 2008, it is normal for the 1-month GLR to be negative and, quite often, the 3-month GLR falls below zero too. In effect, the Central bank is paying the bullion bank to take their gold – this might sound strange, but as the value of physical gold has shot up in recent years so has the cost of things like insurance and storage and so it makes sense for someone else to be bearing these costs whilst you effectively still retain the asset.
If, for whatever reason, the GLR is suddenly and dramatically cut a flood of selling (and therefore drop in the price of gold) takes place as the bullion banks take advantage of the lower leasing rates to “acquire” more gold to sell so as to raise more capital to invest in higher yield securities and thus increase their profits.
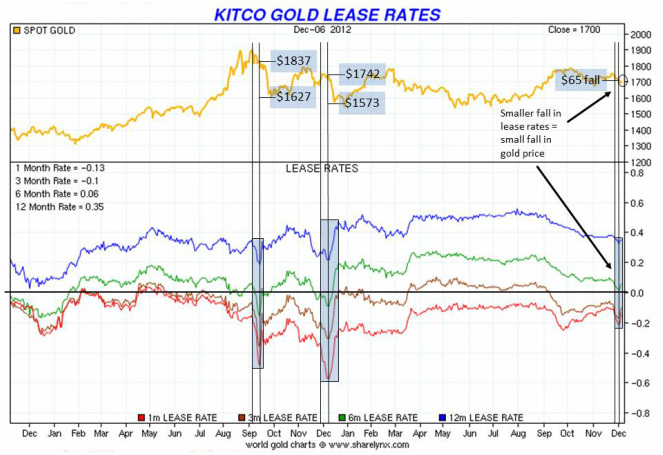
We’ll leave it to you to surmise the different reasons why these sharp drops in the GLR take place – as we said previously, we are not conspiracy theorists. What we do know is that, between 23rd November and 26th November 2012 the 1, 3, 6 & 12-month GLRs fell quite sharply and that this was followed on the 27th by an unexpected fall in the gold price from $1749 to a low of $1684 over the next 5 days. By the 27th the GLRs had returned to their pre-fall levels, but gold nose-dived $65 against the trend.
This can be seen with even greater clarity in September 2011 and December 2011 when you look at the chart below:
Can we trade using this information?
There is clear evidence that a sharp fall of the GLR precedes a sharp fall in the gold price by a day or two on numerous occasions and so this can be used to help make trading decisions – if you see this pattern emerging you have to question whether it is wise to take a long position.
The GLR is dynamic and affected by many different factors as it is a derivative of LIBOR and GOFO – it is always changing and therefore basing all trading decisions on whether it is rising or falling would be unwise.
From our analysis there is no direct correlation between the GLR and the price of gold per-se – but when a sharp fall of the GLR is sustained over 2 or 3 days it looks like a good time to go short!
Get more free articles like this helping you learn how to trade online.
You can get a 30-day historical view of the Gold Lease Rate at www.kitco.com and longer-term charts are available at www.sharelynx.com


