UK Gold Trading Experts
  • Home
  • Trade Like a Pro
  • Gold Blog
  • Subscriber Resources
  • Legal Stuff
    • User Agreement
  • Contact Us

Using the Value of the Dollar to Predict Gold Price Movements

14/2/2014

10 Comments

 
Online Trading Using USD Values to Predict Gold Price
It is a general rule that gold operates inversely in relation to the US Dollar.  If the dollar is down, gold is up as other currencies are now stronger than the dollar and can therefore acquire more gold for the same cost – therefore this increases demand for gold; and visa-versa.

This means that you can get a reading on the direction that gold is likely to move in by monitoring for big moves in the forex markets - as forex moves precursor those in gold.

Get more free articles like this helping you learn how to trade online.


Whilst you can trade the dollar against any other currency, it’s predominantly traded against Euros (depicted as EUR/ USD) or British Pounds (GBP/ USD).  For both currency pairs the exchange rate is stated as the value of one Euro or Pound against the US Dollar – i.e. GBP/ USD 1.6000 means that for every British Pound I hold it is worth 1.6000 US Dollars.

Gold acts like a currency in its own right and, as it’s priced in dollars, it makes sense to think of its “exchange rate” being that of its current price for an ounce of gold.

All exchange rates are linked – so if the current gold price (i.e. “gold’s exchange rate”) is $1600 per ounce and the exchange rate between the GBP/ USD is 1.6000 (keeping things simple) we can deduce that if I’m holding £10,000 then I can purchase 10 ounces of gold (£10,000 x 1.6000 = $16,000/ $1,600 = 10 ounces) .  If the dollar weakens against the pound to a rate of GBP/ USD 2.0000 my £10,000 would now buy me 12.5 ounces of gold (£10,000 x 2.0000 = $20,000/ $1,600 = 12.5 ounces).

Because I can now buy more gold for the same amount of money it represents a better investment and so I’m all over it it…but so is everyone else who is holding £’s (or whichever currency has advanced against the $) and so very quickly the price of gold increases due to increased demand.  Simple economics.

Irrespective of the direction - if there is a substantial change to the value of dollar it tends to result in an inverse impact to the price of gold and, as gold reacts to the dollar price, it passes through its own technical thresholds which exacerbate or limit the impact.

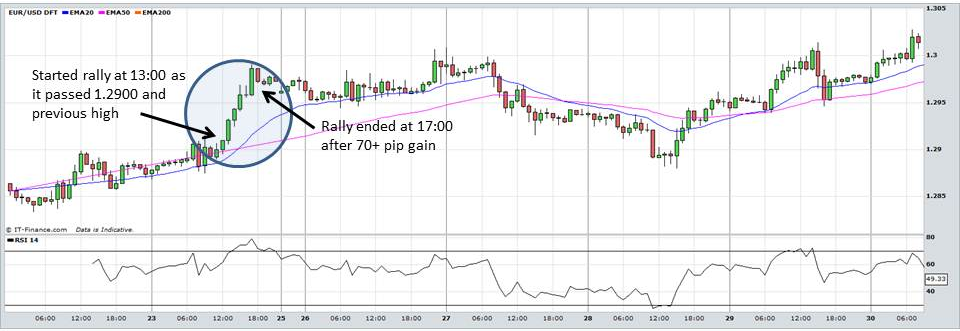
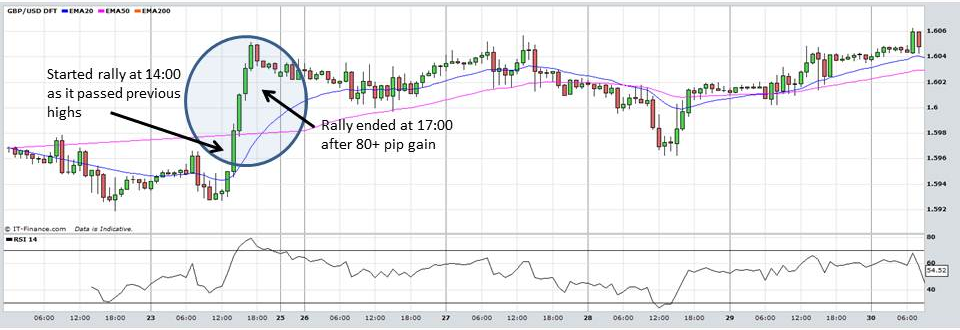
The following charts from 23rd November 2012 help illustrate this.  Bear in mind that the 23rd Nov was supposed to be a quiet day trading as it was the Friday after Thanksgiving in the US and so is traditionally treated almost like a public holiday and therefore trading is very light.  The first two charts are hourly EUR/ USD and GBP/ USD respectively:

Trade Gold Online - EUR/ USD Chart
Trade Gold Online - GBP/ USD Chart
Both currency pairs advanced quickly against the dollar (as you can see from the charts it is very common that EUR and GBP move in similar patterns against USD) once they’d broken through resistance levels between 12pm to 2pm.
Trade Gold Online - Spot Gold Chart
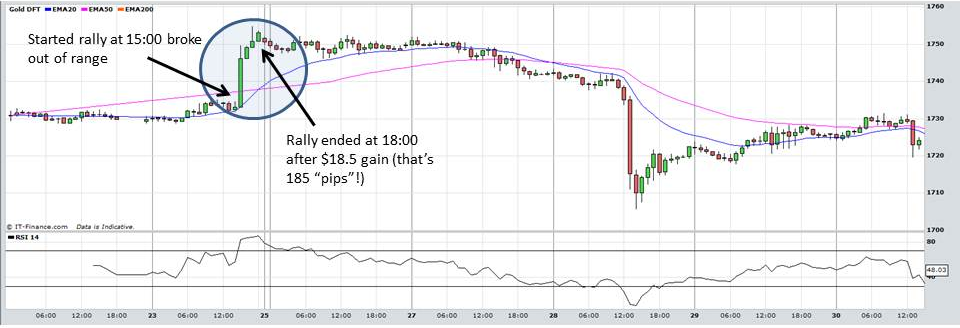
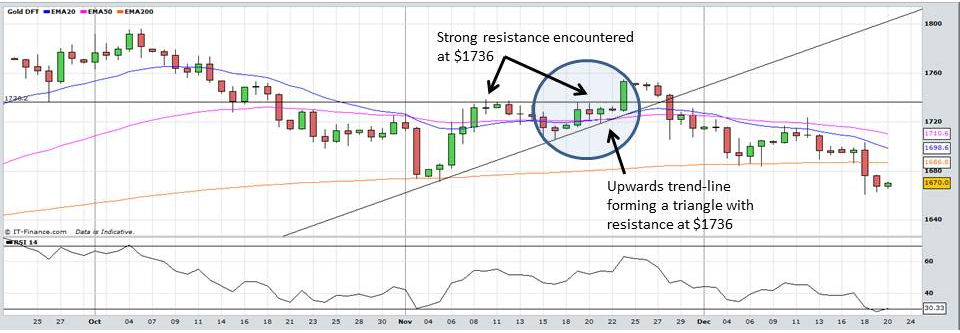
The chart above shows the hourly gold spot price on the same day.  Notice how there was a very flat period prior to the rally starting – no-one was really expecting any movement in gold due to the US holidays.  As EUR and GBP made substantial gains against USD the price of gold reacted and broke out of the fairly narrow range it had been trading in for the previous 3 weeks.  In the preceding week it had been on an upwards trajectory, but couldn’t break through the 1736 level despite several tests and thus a triangle had formed as shown on the daily chart below:
Trade Gold Online - Spot Gold Chart
Usually in this chart pattern, when price breaks-out to the upside, it does so with some gusto and this was no different – the impact of a weaker dollar pushed the gold price through the resistance level at $1736 and helped to continue to drive it higher as stops were taken out and buy orders were triggered around 1740-1473.  The rally in gold finished about 1 hour after both EUR and GBP rallies abated.

How can we use this in Gold Trading?

Like all indicators, it is not fool-proof and so shouldn’t be traded off of alone.  We publish numerous articles explaining how external events impact the price of gold – the same rules apply to all and that is that these should be monitored and used to help guide your trading, but should not be the only determining factor.

You need to still be aware of the technical picture in gold itself – resistance & support levels, Fibonacci and Elliot Wave patterns, trendlines and moving averages will all play a part in exacerbating or limiting the impact of dollar-driven movements as we’ve highlighted above.

Having the EUR/ USD and GBP/ USD charts open throughout the day and monitoring for big movements should be a given.  Make sure that you check them before making trading decisions – they can influence when you enter or exit, or when you move your stop loss.

When you see a strong movement in either direction which converges with a technical breakthrough on the gold chart, jump on it – more often than not it will work in your favour and usually with large gains to be made.

Our subscribers benefit from our insight and expertise being applied in real-time.  Sign-up here for a FREE 2-Week Trial

Get more free articles like this helping you learn how to trade online.


10 Comments
John Watson link
1/3/2013 06:18:34 pm

Very interested in the short term future of gold!

Reply
Epic Researh link
16/1/2015 04:14:17 am

The dollar weakened across the board after official figures showed that U.S. retail sales fell 0.9% last month, the largest decline since last January after rising 0.4% in November.

Reply
Free equity tips on mobile link
19/11/2015 10:04:31 am

This is a very fast accuracy factor in the gold to occupy space in the market to perform well.

Reply
Best Cash Plus Tips In Indore link
3/3/2016 11:17:09 am

Wow!! This is something I was searching for many days. My thirst has been quenched now after reading your article.

Reply
how to trade link
6/5/2016 05:19:18 am

Today’s news calendar for the US trading session is relatively quiet, but we do have some events this week that could spur on some market movement and you will want to make note of those on your own financial calendars throughout the entire week, going all the way into Friday with US non-farm payrolls.

All right, let’s get started here with the US Dollar versus the Swiss Franc [USDCHF]. We’re looking at the daily timeframe. In the live, daily Trade Room, we’ve been discussing this downward-facing channel here. The two red trend lines that you see here on my chart. Downward-facing channel. Throughout the past couple of weeks, we’ve been studying the rising within that pattern.

Previously, along the blue trend lines, we saw it find a low along the bottom and rise all the way to the top. In a recent pattern, we saw it find a low, but not making it all the way – quite all the way – to the top of the pattern, and now falling back down towards the mid-0.9500s. Of course that doesn’t mean we have turned all the way back down and we’re going to see it go all the way back down to the bottom, but definitely something to take note of is the fact that we have not completed the pattern this time so far and moved all the way to the top of the range.

If it starts to go bullish again, we would of course look to target back to the top of the range, but currently, last week, the market was clearly bearish here for the USDCHF. Of course like I said, we have news events all this week that could change everything that we’re looking at here on this currency, but definitely, at least at this current point, we have a bearish momentum built into the market.

Let’s go ahead and zoom in a little bit here on the daily timeframe. Five days in a row it’s been going down. Doesn’t mean it has to continue down, but definitely something that you would take note of. If you’re looking to sell in this direction, there’s two reasons to sell it. I think, first off, you would look for it to come back up here into this pink zone, close to the 0.9600-level, if you’re looking to go short. I don’t think at the current moment it’s a good idea to go short because we’re clearly into the support level, into the mid to upper-0.9500s, the green-shaded area.

So, currently the green-shaded area is our support. If you’re looking to go short again, it either needs to go up to the pink zone or break through this green-shaded area, and then we could look for it to tackle the next support, which is down here at the purple-shaded area. If we start to see some evidence of reversal, maybe a break above the pink zone, we might look for the bullish action to return, but currently bearish, and I think that’s probably the direction at least for the first part of this week that we’ll continue to focus our efforts on.

Down here to the four-hour timeframe. You could see it’s kind of stuck right now between the pink and the green-shaded area. So, what I would expect that we’re looking for is a breakout of this congestion that we’re in right now. Above it, may start to signal the upside again for the USDCHF. Below it, as it is right now, and getting below the green-shaded area, further movement down towards the 0.9500-level would likely be expected. So, watching for a breakout of this congestion will probably be your key to direction for the USDCHF this week.

Reply
Raj link
15/8/2016 12:10:58 pm

See this is cost price of product
We send you product
Checked product
Here is payment deliver goods

Reply
kumar
23/6/2018 06:15:33 am

Let me explain the basic principle how most Forex systems work. They are tuned up to work in a specific market condition. They often make money in a trending market, but loose money in a choppy market. It is not a problem as long as the market is trending and the system is making more money than it loses. Such a system can be profitable for several months and you would be happy with it. BUT...

PREPARE FOR THE WORST...

Market change over time. A well designed system starts with trend analysis to stay away from potentially losing trades. There are two problems of how a Forex system recognizes the trend.

PROBLEM: FALSE "STRONG TREND" INDICATION.

The system responds only to immediate price action. An explosive price movement that is usually the result of news release is tempting people to jump in and make a profit. It looks like a "strong trend", but what usually happens next is a hard fall.

To avoid falling into this trap, check for the SOLUTION to find a REAL trend:

==> http://www.forextrendy.com?nsjjd92834

SECOND PROBLEM: TREND RELIABILITY

Most systems use various indicators to determine the trend. Actually, there is nothing bad about using indicators. One Simply Moving Average can do the job. The problem comes with the question: "Is the market trending NOW?" Whether the market is trending or not trending is not like black and white. The correct question is: "How well the market is trending?"

And here we have something called TREND RELIABILITY.

Trends exist and they can be traded up and down for a profit. You have to focus only on the most reliable market trends. "Forex Trendy" is a software solution to find the BEST trending currency pairs, time frames and compute the trend reliability for each Forex chart:

==> http://www.forextrendy.com?nsjjd92834

Reply
sr software solutions
11/7/2018 07:02:54 am

Which Forex pair and time frame is best to trade" is the frequently asked question and I want do give you the DEFINITE ANSWER.

Are you expecting that I am going to say something like EUR/USD on 5-minute time frame or GBP/USD on daily...? No, it is not so simple, but SIMPLE ENOUGH we can figure it out!

The "PROBLEM" is that markets change over time. If GBP/USD was a well trending currency pair a few years ago, today it is another one.

I actually want to let you know about a SPECIAL TOOL that I use to find the BEST TRENDING PAIRS among all the Forex pairs.

http://www.forextrendy.com?vhbshygdf398432

The software scans 34 Forex pairs on all time frames from minute to monthly. This way you pick the best trending pair and time frame at the current time.

The system is running on our powerful computers, so you have nothing to download and install. Just join in and start using it within a FEW MINUTES! Get it on the link below:

http://www.forextrendy.com?vhbshygdf398432

Reply
dineh7gj link
14/7/2018 11:29:47 am


Drawing trend lines is one of the few easy techniques that really WORK. Prices respect a trend line, or break through it resulting in a massive move. Drawing good trend lines is the MOST REWARDING skill.

The problem is, as you may have already experienced, too many false breakouts. You see trend lines everywhere, however not all trend lines should be considered. You have to distinguish between STRONG and WEAK trend lines.

One good guideline is that a strong trend line should have AT LEAST THREE touching points. Trend lines with more than four touching points are MONSTER trend lines and you should be always prepared for the massive breakout!

This sophisticated software automatically draws only the strongest trend lines and recognizes the most reliable chart patterns formed by trend lines...

http://www.forextrendy.com?kdhfhs93874

Chart patterns such as "Triangles, Flags and Wedges" are price formations that will provide you with consistent profits.

Before the age of computing power, the professionals used to analyze every single chart to search for chart patterns. This kind of analysis was very time consuming, but it was worth it. Now it's time to use powerful dedicated computers that will do the job for you:

http://www.forextrendy.com?kdhfhs93874


Reply
sr link
21/7/2018 07:15:27 am

"Which Forex pair and time frame is best to trade" is the frequently asked question and I want do give you the DEFINITE ANSWER.

Are you expecting that I am going to say something like EUR/USD on 5-minute time frame or GBP/USD on daily...? No, it is not so simple, but SIMPLE ENOUGH we can figure it out!

The "PROBLEM" is that markets change over time. If GBP/USD was a well trending currency pair a few years ago, today it is another one.

I actually want to let you know about a SPECIAL TOOL that I use to find the BEST TRENDING PAIRS among all the Forex pairs.

http://www.forextrendy.com?vhbshygdf398432

The software scans 34 Forex pairs on all time frames from minute to monthly. This way you pick the best trending pair and time frame at the current time.

The system is running on our powerful computers, so you have nothing to download and install. Just join in and start using it within a FEW MINUTES! Get it on the link below:

http://www.forextrendy.com?vhbshygdf398432

Reply


Leave a Reply.

    Old Posts

    August 2021
    July 2021
    June 2021
    May 2021
    March 2021
    February 2021
    January 2021
    December 2020
    November 2020
    March 2019
    January 2019
    December 2018
    October 2018
    September 2018
    August 2018
    July 2018
    June 2018
    May 2018
    March 2018
    February 2018
    July 2017
    June 2017
    May 2017
    April 2017
    March 2017
    February 2017
    January 2017
    December 2016
    July 2016
    March 2016
    December 2015
    November 2015
    October 2015
    September 2015
    August 2015
    July 2015
    June 2015
    May 2015
    April 2015
    March 2015
    February 2015
    January 2015
    December 2014
    November 2014
    October 2014
    September 2014
    August 2014
    July 2014
    June 2014
    May 2014
    April 2014
    March 2014
    February 2014
    January 2014
    December 2013
    November 2013
    October 2013
    September 2013
    August 2013
    July 2013
    June 2013
    May 2013
    April 2013
    March 2013
    February 2013
    January 2013
    December 2012
    November 2012
    October 2012
    September 2012
    August 2012
    July 2012
    June 2012
    May 2012
    April 2012
    March 2012
    February 2012
    January 2012
    December 2011
    November 2011
    October 2011

UK Gold Trading Experts (UKGTE) is a trading name of Drupac Limited, a company registered in England and Wales (company number 09167819) whose registered office is 1 St. Paul's Square, Birmingham, B3 1QU.