UK Gold Trading Experts
  • Home
  • Trade Like a Pro
  • Gold Blog
  • Subscriber Resources
  • Legal Stuff
    • User Agreement
  • Contact Us

Gold Market Update - 17th Mar

17/3/2014

0 Comments

 
Trade Gold Online Trader
Gold moved higher on Friday to close the week strongly, over 40 points higher on the week at 1382.  This morning gold has tested the key long term 65 week moving average at 1391.

We expect this level, which also coincides with an important down trend line, to provide resistance and would not be surprised to see a sell off from this area.

Although there are no signs of a top yet, RSI is overbought on the daily and 4 hour charts and gold may struggle to move much higher in the short term.

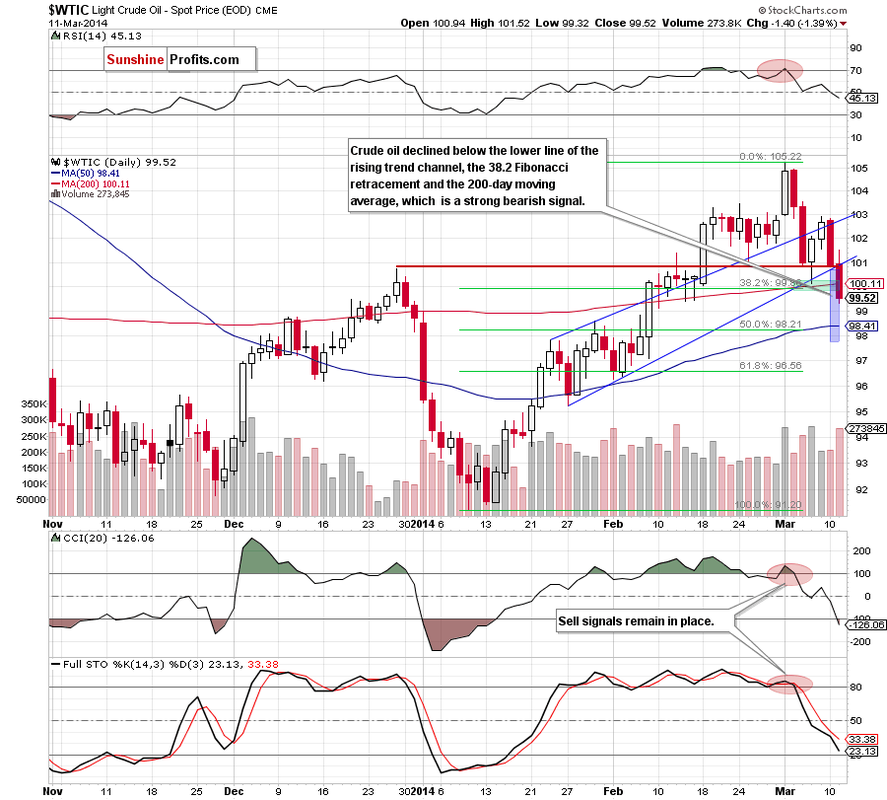
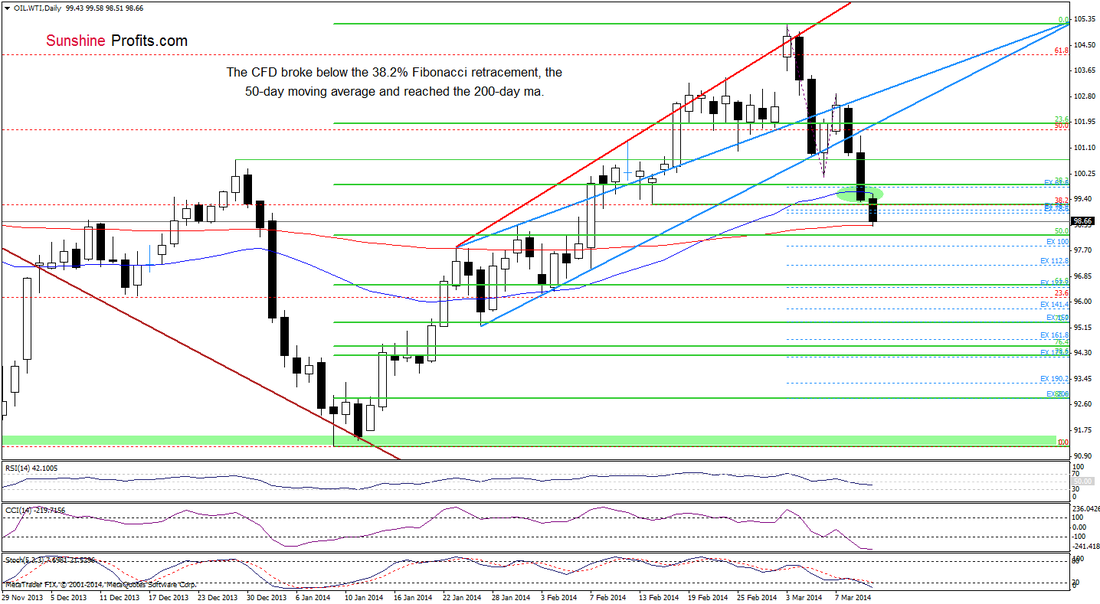
The dollar remains weak, though is holding above 79 and oil has tumbled sharply in recent days to trade around $98 a barrel.  This week sees little in the way of economic news and the turmoil in Ukraine appears to have settled down for now, so we may see a quiet week of trading.

Support can be found at 1375-1380, 1360-1363, 1354, 1350, 1340, 1330-1332, 1322, 1312-1315, 1307, 1295-1300 and 1280.

Resistance can be found at 1391, 1395-1400, 1420 and 1435.  The breakout above 1300 suggests an end to the intermediate term down trend and that a significant rally is now developing.

Today's video for subscribers looks at the recent trading in more detail and our thoughts for our next trade.

0 Comments

Gold Market Update - 13th Mar

13/3/2014

0 Comments

 
Trade Gold Online Trader
Gold powered higher yesterday, breaking through resistance at 1355 and moving as high as 1375 this morning, touching the top boundary of the uptrend channel.

The dollar continues to exhibit weakness, this is driving gold higher however oil remains weak and silver is lagging markedly behind gold - this flashes a warning that the rally may not be built on solid foundations as sliver usually leads gold higher in a bull market.

The RSI bearish divergecne persists and is another signal that all is perhaps not rosy with this gold rally - at the very least caution is warranted.  In addition, gold has alomst reached the next longer term resistance level on the weekly chart.

Support can be found at 1360-1363, 1354, 1350, 1340, 1330-1332, 1322, 1312-1315, 1307, 1295-1300 and 1280.

Resistance can be found at 1375-1380, 1395-1400, 1420 and 1435.  The breakout above 1300 suggests an end to the intermediate term down trend and that a significant rally is now developing.

Today's video for subscribers looks at the recent trading in more detail and our strategy for our next trade.

0 Comments

Gold & Silver Trading Alert: Copper’s Breakdown

12/3/2014

0 Comments

 
Gold & Silver Trading Alert originally published on March 12, 2014 6:46 AM by SunshineProfits.com
Briefly: In our opinion short speculative positions (half) in silver and mining stocks are justified from the risk/reward perspective.

There were basically no changes in gold, silver and mining stock charts yesterday, except for gold moving slightly higher on news about increased tensions in Ukraine. Gold’s reaction was once again weak.

As a reminder, here’s what we wrote on March 3:
"Given greater uncertainty and increased geo-political tensions we expect gold to outperform the rest of the precious metals sector in the near future. Technically, as you will see in the following part of today’s alert, the situation deteriorated. Therefore, if the tensions ease, the move lower could be simply bigger – markets would give away the tension-based rally and then move lower just as if this weekend’s events didn’t happen. Consequently, at this time we are not suggesting moving fully back in for the entire precious metals sector. Normally, we would suggest going back in with half of each part of the sector (gold, silver, platinum and mining stocks), but at this time it seems that it would be better to move back fully in with gold and leave the rest out. In this case we are somewhat half-in but are also positioned to utilize gold’s expected outperformance."
Since that time gold has been indeed outperforming mining stocks and, especially, silver.

In today’s alert we decided to show you two charts that seem most critical as far as determining the outlook for the following weeks is concerned (charts courtesy of http://stockcharts.com):
Picture
Silver moved higher during the session but did so only initially. The rest of the session was largely about canceling the previous move and ultimately silver closed more or less where it had begun the session. Silver’s slight move higher took place on low volume, which is not a bullish sign.
Picture
In today’s alert we would like to draw your attention to one of the markets that is not the part of the precious metal sector, but that has lead the precious metals quite often in the previous years – copper.

Copper broke below the rising support line many months ago, but it wasn’t until yesterday that it moved below the 2013 lows. The decline here seems to continue and the downside target is quite far away. Could copper decline so far? Of course – it declined even further in 2008.

As you can see on the above chart, the major price moves have taken place simultaneously in copper and the precious metals sector. Copper’s breakdown is therefore a bearish factor for the precious metals sector, which might simply follow copper lower.

Technically speaking, there is strong support in the $2.1 - $2.2 range, and if copper declines significantly, that’s where we expect the bottom to form. That’s quite far from where copper is today, so if precious metals are to move similarly to copper, they too might decline quite profoundly.

It seems that the precious metals sector will move lower in the coming weeks, but just in case the situation in Ukraine deteriorates, we are keeping half of the long-term investment position in gold.
To summarize:

Trading capital (our opinion): Short position (half): silver and mining stocks.

Stop-loss details:

- Silver: $22.60

- GDX ETF: $28.9

Long-term capital (our opinion): Half position in gold, no positions in silver, platinum and mining stocks.

Insurance capital (our opinion): Full position

You will find details on our thoughts on gold portfolio structuring in the Key Insights section on our website.

As a reminder, our latest report on mining stocks rebalancing is available free of charge and we encourage you to read it.
Thank you.

Przemyslaw Radomski, CFA

Founder, Editor-in-chief

Tools for Effective Gold & Silver Investments - SunshineProfits.com

Tools für Effektives Gold- und Silber-Investment - SunshineProfits.DE


Disclaimer

All essays, research and information found above represent analyses and opinions of Przemyslaw Radomski, CFA and Sunshine Profits' associates only. As such, it may prove wrong and be a subject to change without notice. Opinions and analyses were based on data available to authors of respective essays at the time of writing. Although the information provided above is based on careful research and sources that are believed to be accurate, Przemyslaw Radomski, CFA and his associates do not guarantee the accuracy or thoroughness of the data or information reported. The opinions published above are neither an offer nor a recommendation to purchase or sell any securities. Mr. Radomski is not a Registered Securities Advisor. By reading Przemyslaw Radomski's, CFA reports you fully agree that he will not be held responsible or liable for any decisions you make regarding any information provided in these reports. Investing, trading and speculation in any financial markets may involve high risk of loss. Przemyslaw Radomski, CFA, Sunshine Profits' employees and affiliates as well as members of their families may have a short or long position in any securities, including those mentioned in any of the reports or essays, and may make additional purchases and/or sales of those securities without notice.

0 Comments

Oil Trading Alert: Crude Oil Drops Below $100

12/3/2014

0 Comments

 
Oil Trading Alert originally published on Mar 12, 2014, 11:13 AM by SunshineProfits.com
Trading position (short-term; our opinion): Short. Stop-loss for crude oil and WTI Crude Oil (CFD): $102.95.

On Tuesday, crude oil lost 1.39% as concerns over a slowdown in China and rising U.S. stockpiles weighed on the price. Because of these circumstances, light crude declined below the psychological barrier of $100 per barrel for the first time since mid-February.

As we emphasized in our last Oil Trading Alert, weak Chinese trade data (released over the weekend) fueled concerns over slowing growth in the world's second largest oil consumer and had a negative impact on the price on Monday. As it turned out, these disappointing numbers continued to push crude oil lower also yesterday, which resulted in a drop below the crucial level of $100. Because of these circumstances, oil investors should keep an eye on fresh economic data from China on Thursday (including industrial output, retail sales and urban investment).

Also yesterday, expectations for another increase in U.S. crude inventories raised concerns amid oil investors and pushed crude oil lower. As a reminder, overall U.S. crude-oil supplies have risen for seven straight weeks (despite falling storage levels in Cushing), but the price of light crude has been supported by strong demand for heating fuels refined from crude oil. However, the EIA showed in its last weekly report that inventories of distillates (such as heating oil and diesel) rose by 1.4 million barrels (instead a drop of 1.1 million barrels), indicating a slowdown in demand as the weather improved. Additionally, we should keep in mind that refinery utilization rates typically fall in February and March as refiners close units for seasonal maintenance. Therefore,  refinery shutdowns may have partly helped in boosting crude stockpiles and such circumstances will likely have a negative impact on the price.

Please note that analysts are expecting that today’s weekly report from the U.S. Energy Information Administration (which will release storage data for the week ended March 7) will show a two million-barrel rise in crude-oil supplies and a 400,000 barrels drop in stocks of distillates (including heating oil and diesel fuel).

Having discussed the above, let’s move on to the technical changes in crude oil (charts courtesy of http://stockcharts.com).
Picture
Quoting our last Oil Trading Alert:
"…if…crude oil drops lower, we will see a re-test of the strength of a support zone created by the 38.2% Fibonacci retracement (based on the entire rally) and the 200-day moving average. (…) if this strong support zone is broken, we will see further deterioration and the first downside target will be the 50% Fibonacci retracement, which is a few cents below the 50-day moving average (currently at $98.41)"

Yesterday, we noticed such price action as crude oil declined below the lower border of the rising trend channel and broke below the support zone. What’s most important, yesterday’s downswing materialized on relative large volume, which confirms the strength of the sellers and suggests that further deterioration to the downside target is quite likely in the coming day (or days). Additionally, sell signals generated by the indicators remain in place supporting oil bears.

Having discussed the current situation in light crude, let’s take a look at WTI Crude Oil (the CFD).

Picture
In our last Oil Trading Alert, we wrote:
"…if oil bulls do not manage come back to the range of the rising wedge, we will likely see another attempt to reach one of the downside targets - 38.2% Fibonacci retracement or even to the Feb.14 low (we marked this area with a green ellipse). Please note that although the Stochastic Oscillator generated a buy signal, both other indicators still support sellers."

Looking at the above chart, we see that the buyers failed, which triggered a sharp decline yesterday. With this downswing, the CFD dropped below the 38.2% Fibonacci retracement and approached the lower target. As you see on the daily chart, yesterday’s drop also resulted in a decline below the 50-day moving average, which serves as resistance at the moment and successfully stopped buyers earlier today. This show of weakness encouraged oil bears to act and triggered a downward move, which took the CFD to the 200-day moving average. If this support line encourage buyers, we may see a corrective upswing later in the day. However if it is broken, we will likely see further deterioration. Please note that the nearest support (the 50% Fibonacci retracement) is slightly below the current level and may pause (or stop) the current correction. However, taking into account the fact that the indicators still support sellers, we may see a drop to $97.84 (the 100% Fibonacci projection based on the 2014 and March 7 highs and March 6 low) or even to the 61.8% Fibonacci retracement (around $96.55) in the coming day (or days).

Summing up, the short-term outlook has deteriorated significantly as crude oil declined below a support zone created by the 38.2% Fibonacci retracement and the 200-day moving average. Taking this negative fact into account and combining with the current situation in the CFD, it seems that further deterioration should not surprise us.

Very short-term outlook: bearish

Short-term outlook: mixed with bearish bias

MT outlook: bullish

LT outlook: mixed

Trading position (short-term): In our opinion, opening short positions at the following terms is a good idea: stop-loss orders for crude oil and WTI Crude Oil (CFD): $102.95. The above is not an investment / trading advice and please note that trading (especially using leveraged instruments such as futures or on the forex market) involves risk.

Thank you.

Nadia Simmons


Forex & Oil Trading Strategist

Forex Trading Alerts

Oil Investment Updates

Oil Trading Alerts

SunshineProfits.com


Disclaimer

All essays, research and information found above represent analyses and opinions of Nadia Simmons and Sunshine Profits' associates only. As such, it may prove wrong and be a subject to change without notice. Opinions and analyses were based on data available to authors of respective essays at the time of writing. Although the information provided above is based on careful research and sources that are believed to be accurate, Nadia Simmons and his associates do not guarantee the accuracy or thoroughness of the data or information reported. The opinions published above are neither an offer nor a recommendation to purchase or sell any securities. Nadia Simmons is not a Registered Securities Advisor. By reading Nadia Simmons’s reports you fully agree that he will not be held responsible or liable for any decisions you make regarding any information provided in these reports. Investing, trading and speculation in any financial markets may involve high risk of loss. Nadia Simmons, Sunshine Profits' employees and affiliates as well as members of their families may have a short or long position in any securities, including those mentioned in any of the reports or essays, and may make additional purchases and/or sales of those securities without notice.

0 Comments

Gold Market Update - 12th Mar

12/3/2014

0 Comments

 
Trade Gold Online Trader
Gold failed to break resistance at 1354 yesterday afternoon, however overnight gold has found some buying out of Asia that took the price back to the top of the uptrend channel at 1363.

The pattern of higher highs and higher lows therefore remains intact, although the large bearish RSI divergence signals that there is a potentially large correction imminent.

Silver remains relatively weak compared to gold, which is a concern for bulls of both metals as silver usually leading gold higher in a bull market.  The dollar remains under 80, supporting gold whilst equities remain off their all time highs with a potential top forming.

Support can be found at 1354, 1350, 1340, 1330-1332, 1322, 1312-1315, 1307, 1295-1300, 1280, 1275, 1250-1255, 1237-1240, 1220-1225, 1210, 1200 and 1180.  A break of 1180 would have serious bearish implications for gold and suggest a decline to 1000-1050 in the short term, though this is looking increasingly unlikely.

Resistance can be found at 1360-1363, 1377-1380, 1395-1400, 1420 and 1435.  The breakout above 1300 suggests an end to the intermediate term down trend and that a significant rally is now developing.

Today's video for subscribers looks at the recent trading in more detail and our thoughts for our next trade.

0 Comments

Gold Market Update - 11th Mar

11/3/2014

0 Comments

 
Trade Gold Online - Daily Gold Trading Blog
Yesterday gold tested the 20 day moving average at 1328 in the Asia session before rebounding strongly throughout the rest of the day.  The low of 1328 formed a double-bottom on the 4-hour chart providing a solid platform for gold to move higher with a target to break-through the previous high in this rally of 1354.

On both the daily and 4 hour charts we see a clear pattern of higher highs and higher lows, maintaining the up-trend that gold has been in for some time now.  We do though need to keep an eye on the bearish RSI divergence that has formed which could signal an imminent reversal.  We’re still looking to get more out of this rally, but ideally need to see 1354 taken out in the next few sessions otherwise it may lose all momentum.

The Dollar climbed a little yesterday, following its fall to a 5-month low on Friday, although it remains locked in a strong down-trend which bodes well for the yellow metal.

On its route to 1400 gold faces strong resistance at 1354, 1360, 1375 and 1385; with support at 1330, 1320 and 1310.  Above 1400 there will be further resistance at 1415, 1425 and 1435. 

0 Comments

Gold & Silver Trading Alert: Silver below $21

11/3/2014

0 Comments

 
Gold & Silver Trading Alert originally published on March 10th, 2014 9:16 AM by Przemyslaw Radomski, CFA, SunshineProfits.com

Briefly: In our opinion short speculative positions (half) in silver and mining stocks are justified from the risk/reward perspective.

We previously emphasized that the situation in Ukraine was the main bullish factor for higher precious metals prices (mainly for the price of gold) and that remains to be the case. However, even though the situation didn’t improve, precious metals moved decisively lower on Friday. This does not bode well for the precious metals market, but let’s examine the key charts before making the final call (charts courtesy of http://stockcharts.com):
Picture
Based on Thursday’s closing prices, we wrote the following:
The volume was very low during yesterday’s upswing, which has bearish implications. We wrote the same yesterday, but this time the implications are clearer as the rally was clearer as well. Bigger rally + very low volume have more bearish implications than a rather small rally on the same volume levels. 
On Friday gold declined on relatively strong volume, which is another confirmation of the bearish outlook. The yellow metal now follows the rally-on-low-volume-but-decline-on-high-volume pattern, which is a bearish phenomenon. High volume usually tells the true direction of the market and in this case it’s down.

The same was the case in the silver market and for mining stocks. Let’s take a look at the latter.

Picture
As you can see on the above chart, the GDX ETF moved higher on low volume but declined (on Friday) on relatively high volume. Again, the implications are bearish, especially that the past few weeks have been similar to the July and August 2013 topping patterns.

Picture
Silver also moved lower – in fact, most decisively in the whole sector. It is now well below the 2008 high and it was the second weekly close below it. Silver is currently below the $21 level. For the bearish outlook to be confirmed (and for us to increase the size of the short position in silver), we would like to see a move below the rising long-term support lines – marked in black and grey on the above chart. They are close to where silver is now, so we may see further deterioration relatively soon.

Picture
Meanwhile, what we wrote about the USD Index regarding the medium-term perspective remains up-to-date:
The USD Index declined below the previous 2014 low (while gold, silver, and mining stocks didn’t move above their 2014 highs), but this “breakdown” doesn’t really have bearish implications. Similar “breakdowns” were followed by significant rallies back in October and December 2013. The breakdown is not confirmed in a technical sense, and it seems doubtful that it will be followed by more weakness or that it will really be sustainable.

Picture
From the short-term perspective, we see that the USD Index declined on Friday but quickly moved back up. It moved to the December 2013 lows, which proved to be support. The most important thing visible on the above chart is the presence and proximity of the cyclical turning point. The USD Index is now right after the turning point, and the preceding move was definitely down, so a turnaround here seems very likely.

All in all, what we wrote previously about the outlook for the precious metals sector remains up-to-date. It doesn’t seem that keeping a full long position in the investment category is justified at this point in our view. Based on last week’s events and what had happened over the weekend it was likely that gold would move much higher – but its reaction has been very weak. It looks like there will be no rally in gold before a bigger decline. We are keeping half of the funds in gold, though, just in case the next days bring improvement (or perhaps the tensions in Ukraine would increase). If not – things will become even more bearish and we will likely adjust the position once again.

We might suggest changing the short-term speculative position and / or the long-term investment one shortly, based on how the markets react and what happens in Ukraine.

In other news, we have recently posted an important report on the role of rebalancing in the case of the mining stocks sector. You can often read that one should do “some rebalancing” but we went much further than that. We dedicated months of research to comparing the classic buy and hold approach with rebalancing and you will find results in our latest report. It’s available free of charge.

To summarize:

Trading capital (our opinion): Short position (half): silver and mining stocks.

Stop-loss details:

- Silver: $22.60

- GDX ETF: $28.9

Long-term capital (our opinion): Half position in gold, no positions in silver, platinum and mining stocks.

Insurance capital (our opinion): Full position

You will find details on our thoughts on gold portfolio structuring in the Key Insights section on our website.

Again, our latest report on mining stocks rebalancing is available free of charge and we encourage you to read it.

Thank you.

Przemyslaw Radomski, CFA

Founder, Editor-in-chief

Tools for Effective Gold & Silver Investments - SunshineProfits.com

Tools für Effektives Gold- und Silber-Investment - SunshineProfits.DE


Disclaimer

All essays, research and information found above represent analyses and opinions of Przemyslaw Radomski, CFA and Sunshine Profits' associates only. As such, it may prove wrong and be a subject to change without notice. Opinions and analyses were based on data available to authors of respective essays at the time of writing. Although the information provided above is based on careful research and sources that are believed to be accurate, Przemyslaw Radomski, CFA and his associates do not guarantee the accuracy or thoroughness of the data or information reported. The opinions published above are neither an offer nor a recommendation to purchase or sell any securities. Mr. Radomski is not a Registered Securities Advisor. By reading Przemyslaw Radomski's, CFA reports you fully agree that he will not be held responsible or liable for any decisions you make regarding any information provided in these reports. Investing, trading and speculation in any financial markets may involve high risk of loss. Przemyslaw Radomski, CFA, Sunshine Profits' employees and affiliates as well as members of their families may have a short or long position in any securities, including those mentioned in any of the reports or essays, and may make additional purchases and/or sales of those securities without notice.

0 Comments

Gold Market Update - 7th Mar

7/3/2014

0 Comments

 
Trade Gold Online Trader
Gold resumed the move upwards yesterday, surging above 1350 on the back of a tumbling dollar that fell 0.63% to 79.50.  The 200 hour MA again provided a reliable level of support and the series of higher highs and higher lows continues, as gold ralleis in a classic uptrend channel.

Equities are rallying hard again and approaching all time highs, however this time gold is rallying with stocks and the dollar is falling rather than gold declining and the dollar moving in line with the stock market.

Gold looks set for another solid weekly gain and a close above the next resistance level at 1361 would be very encouraging for further gains next week.

Support can be found at 1340, 1330-1332, 1322, 1312-1315, 1307, 1295-1300, 1280, 1275, 1250-1255, 1237-1240, 1220-1225, 1210, 1200 and 1180.  A break of 1180 would have serious bearish implications for gold and suggest a decline to 1000-1050 in the short term, though this is looking increasingly unlikely.

Resistance can be found at 1350, 1360, 1377-1380, 1395-1400, 1420 and 1435.  The breakout above 1300 suggests an end to the intermediate term down trend and that a significant rally is now developing.

Today's daily video for subscribers looks at the recent trading in mroe detail and our thoughts for our next trade.

0 Comments

Gold Market Update - 6th Mar

6/3/2014

0 Comments

 
Trade Gold Online Trader
Gold consolidated recent gains yesterday, trading in a narrow range with the high of the day coming in at 1342 and the low at 1332, the 200 hour MA providing reliable support.

Gold is moving steadily higher in a clear uptrend, with a weak dollar and rallying oil price providing a boost to the yellow metal, however a resumption of the rally in equities could cap gains in gold and divert investment funds away from commodities in general.

We are now in a seasonally strong period of the year for gold prices, with March to May usually seeing appreciable gains. With a new rally phase underway, we expect this Spring to be a good one for gold.

Support can be found at 1330-1332, 1322, 1312-1315, 1307, 1295-1300, 1280, 1275, 1250-1255, 1237-1240, 1220-1225, 1210, 1200 and  1180.  A break of 1180 would have serious bearish implications for gold  and suggest a decline to 1000-1050 in the short term, though this is looking increasingly unlikely.

Resistance can be found at 1340, 1350,  1360, 1377-1380, 1395-1400, 1420 and 1435.  The breakout above 1300 suggests an end to the intermediate term down trend and that a significant rally is now developing.

Today's video for subscribers looks at the recent trading in more detail and our targets for this rally in gold.

0 Comments

Gold Market Update - 5th Mar

5/3/2014

0 Comments

 
Trade Gold Online Trader
Gold retreated to support at the 200 hour MA yesterday, as Russia held back from further military action in Ukraine, however the metal remains in an uptrend, with a series of higher highs and higher lows on the charts.

Equities rebounded strongly yesterday, pressuring gold whilst oil tumbled, however ignoring the "noise" of the Ukranian situation, the trend in gold is unmistakenly up.  The dollar remains weak near 80 though equities appear to have finished their correction and are looking likely to progress further.

Support can be found at 1330-1332, 1322, 1312-1315, 1307, 1295-1300, 1280, 1275, 1250-1255, 1237-1240, 1220-1225, 1210, 1200 and  1180.  A break of 1180 would have serious bearish implications for gold  and suggest a decline to
1000-1050 in the short term, though this is looking increasingly unlikely.

Resistance can be found at 1340, 1350,  1360, 1377-1380, 1395-1400, 1420 and 1435.  The breakout above 1300 suggests an end to the intermediate term down trend and that a significant rally is now developing.

Today's video for subscribers looks at the recent trading and our strategy for our next trade.

0 Comments
<<Previous
Forward>>

    Old Posts

    August 2021
    July 2021
    June 2021
    May 2021
    March 2021
    February 2021
    January 2021
    December 2020
    November 2020
    March 2019
    January 2019
    December 2018
    October 2018
    September 2018
    August 2018
    July 2018
    June 2018
    May 2018
    March 2018
    February 2018
    July 2017
    June 2017
    May 2017
    April 2017
    March 2017
    February 2017
    January 2017
    December 2016
    July 2016
    March 2016
    December 2015
    November 2015
    October 2015
    September 2015
    August 2015
    July 2015
    June 2015
    May 2015
    April 2015
    March 2015
    February 2015
    January 2015
    December 2014
    November 2014
    October 2014
    September 2014
    August 2014
    July 2014
    June 2014
    May 2014
    April 2014
    March 2014
    February 2014
    January 2014
    December 2013
    November 2013
    October 2013
    September 2013
    August 2013
    July 2013
    June 2013
    May 2013
    April 2013
    March 2013
    February 2013
    January 2013
    December 2012
    November 2012
    October 2012
    September 2012
    August 2012
    July 2012
    June 2012
    May 2012
    April 2012
    March 2012
    February 2012
    January 2012
    December 2011
    November 2011
    October 2011

UK Gold Trading Experts (UKGTE) is a trading name of Drupac Limited, a company registered in England and Wales (company number 09167819) whose registered office is 1 St. Paul's Square, Birmingham, B3 1QU.