UK Gold Trading Experts
  • Home
  • Trade Like a Pro
  • Gold Blog
  • Subscriber Resources
  • Legal Stuff
    • User Agreement
  • Contact Us

Gold Market Update - 28th Nov

28/11/2014

0 Comments

 
LONG TERM TREND:                  BEARISH
INTERMEDIATE TERM TREND:    BEARISH
SHORT TERM TREND:                NEUTRAL/BEARISH
VERY SHORT TERM TREND:      BEARISH

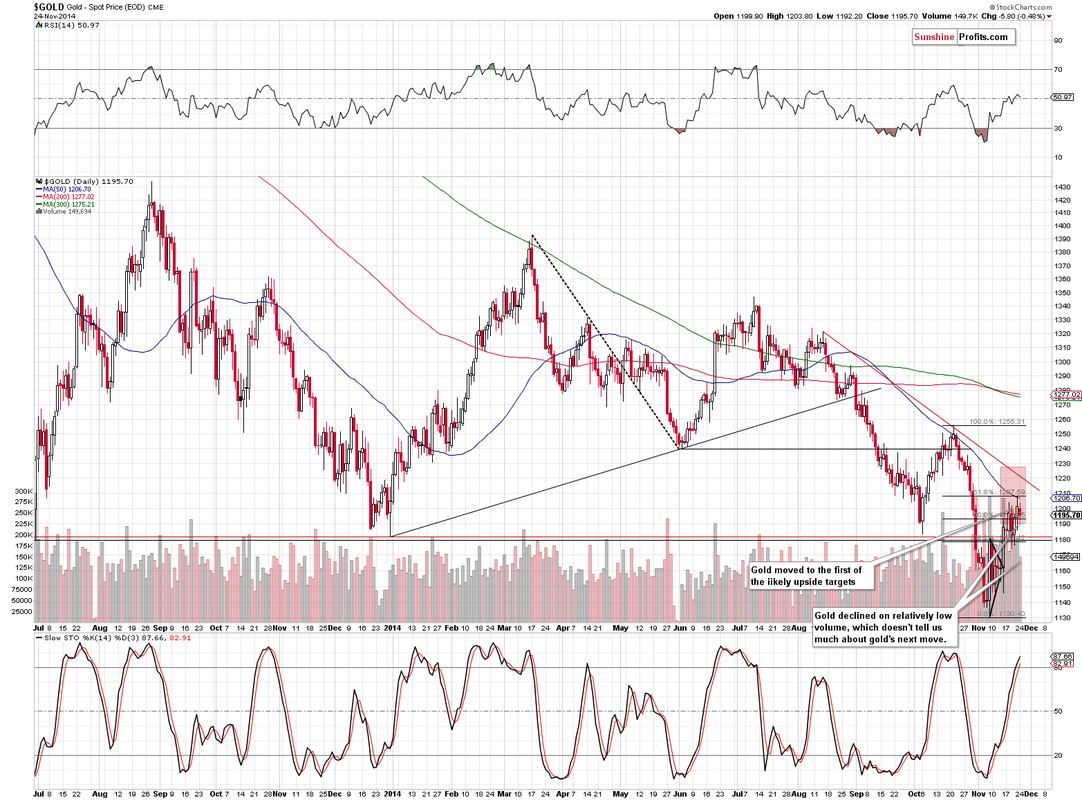
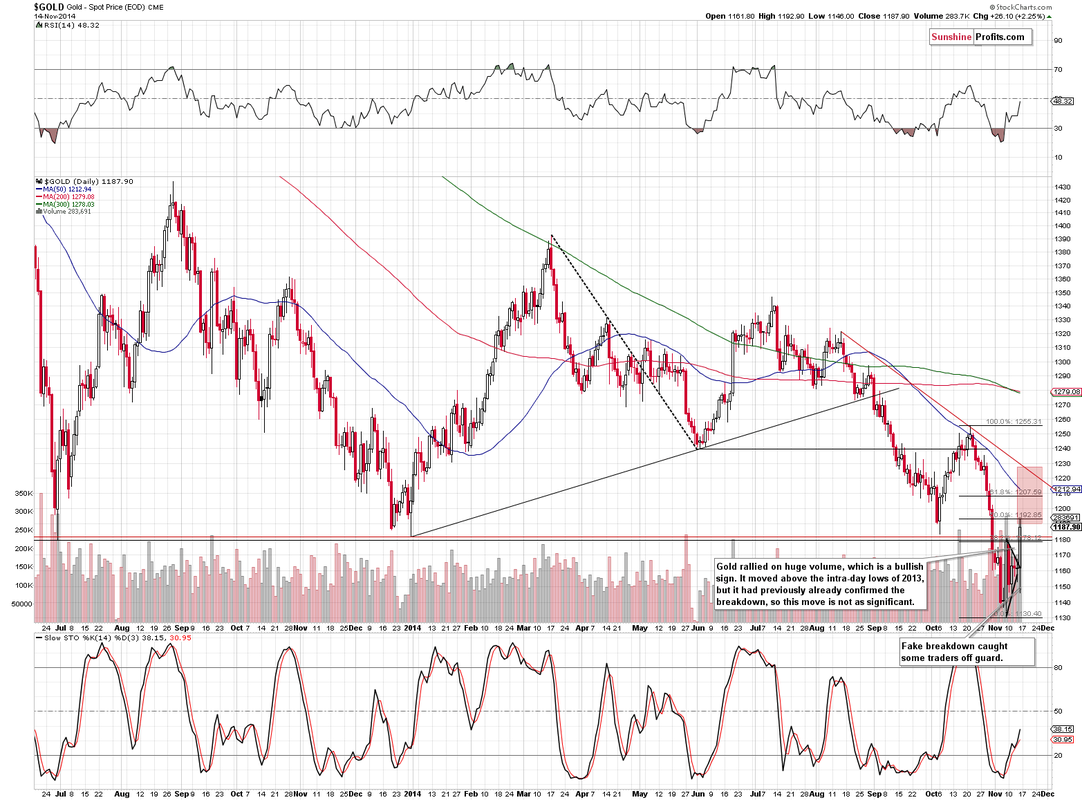
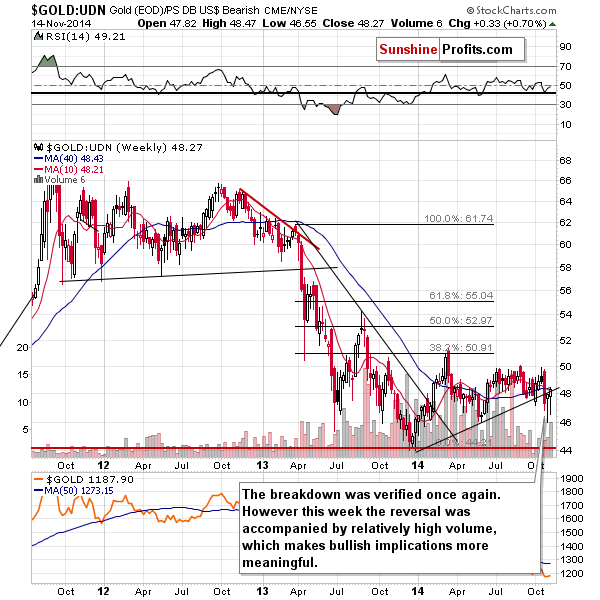
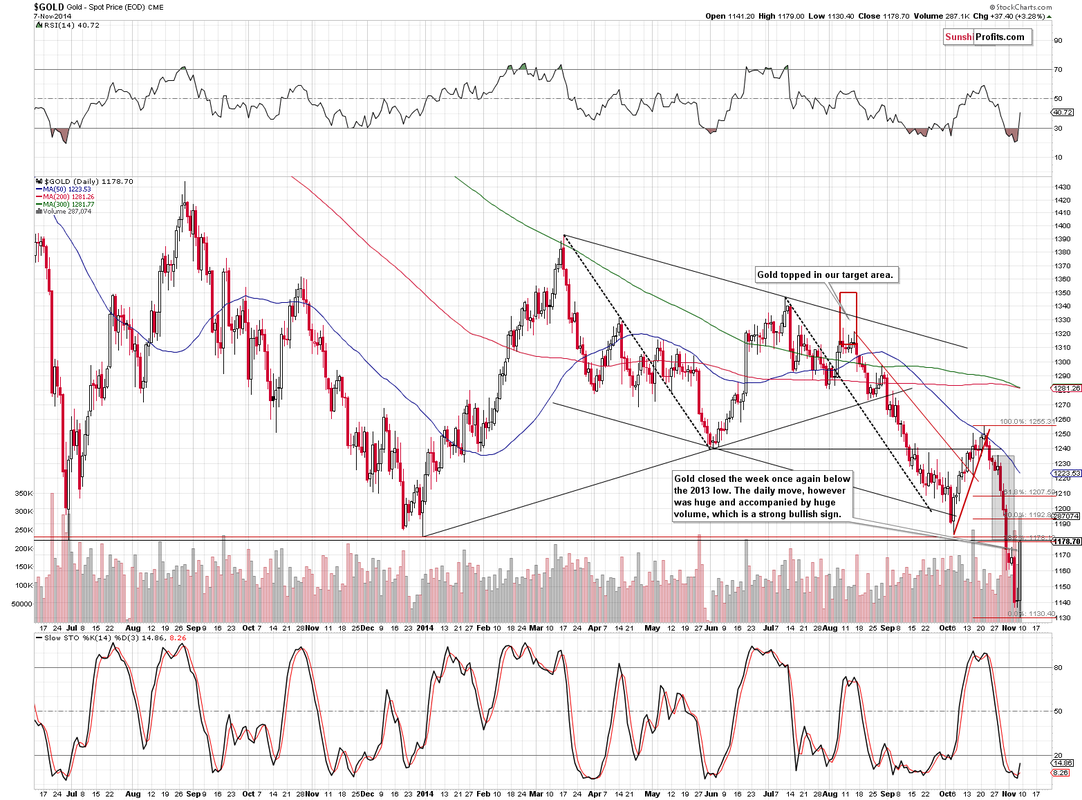
Although the trading volumes have been light due to the Thanksgiving holiday in the US, gold broke below the lower boundary of the bearish rising wedge as expected and is now declining after finding strong resistance at the 61.8% retracement level and the 50 DMA last week.

The catalyst for the decline has been the cratering oil price as a result of OPEC maintaining their production levels, as a "price war" with US shale producers takes hold.  With Crude Oil now trading below $70 a barrel for the first time in 4 years, inflation concerns have completely disappeared and gold will inevitably suffer.

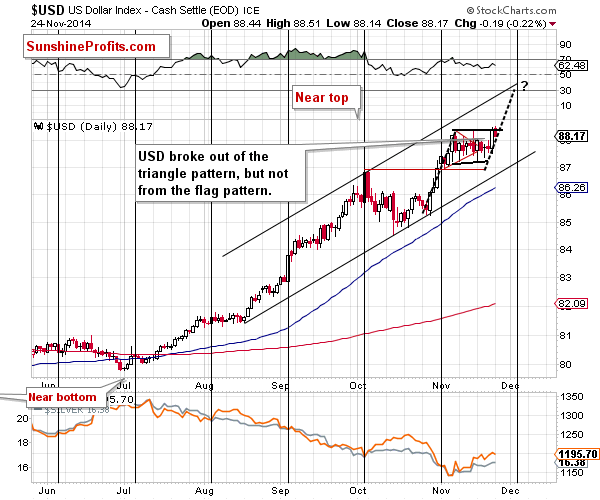
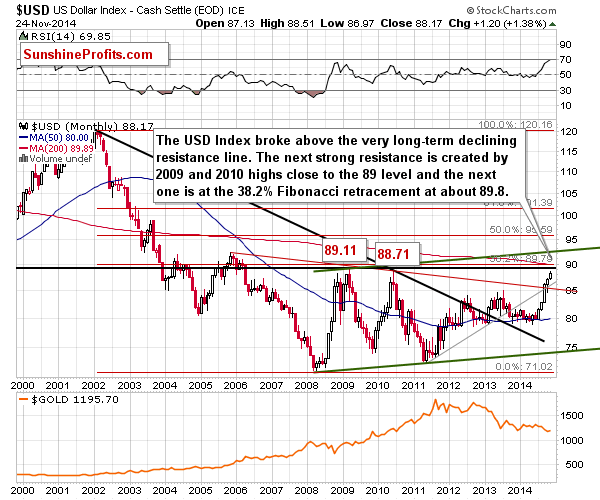
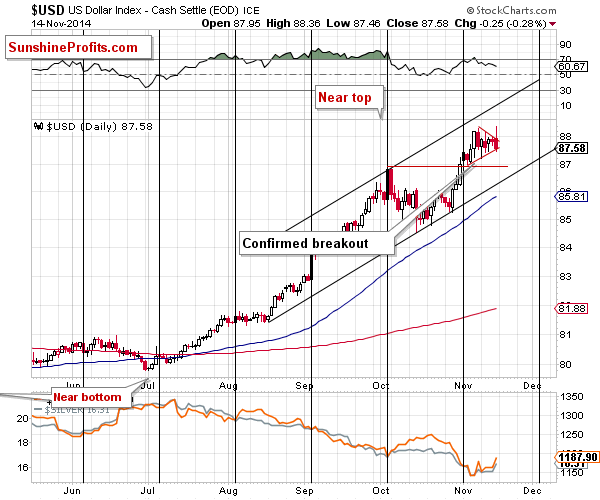
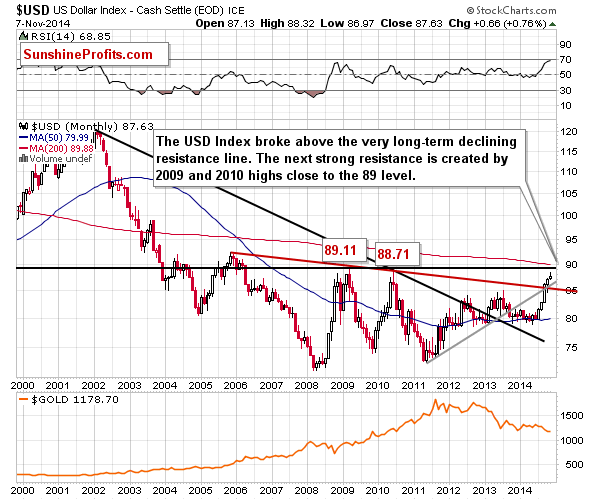
Equities remain the story, with a strong dollar weighing in to undermine gold's appeal - we maintain our stance that there is little reason to hold gold at the moment, other than a core insurance holding of say 10% of a balanced portfolio.

Support can be found at 1180-1183, 1175-1178, 1154, 1145-1147, 1131, 1124, 1100, 1085, 1045 and 1000 . The break of 1180 has serious bearish implications for gold and suggests a decline to 1000-1050 in the short term, unless gold can hold above this level and build a base to move higher.

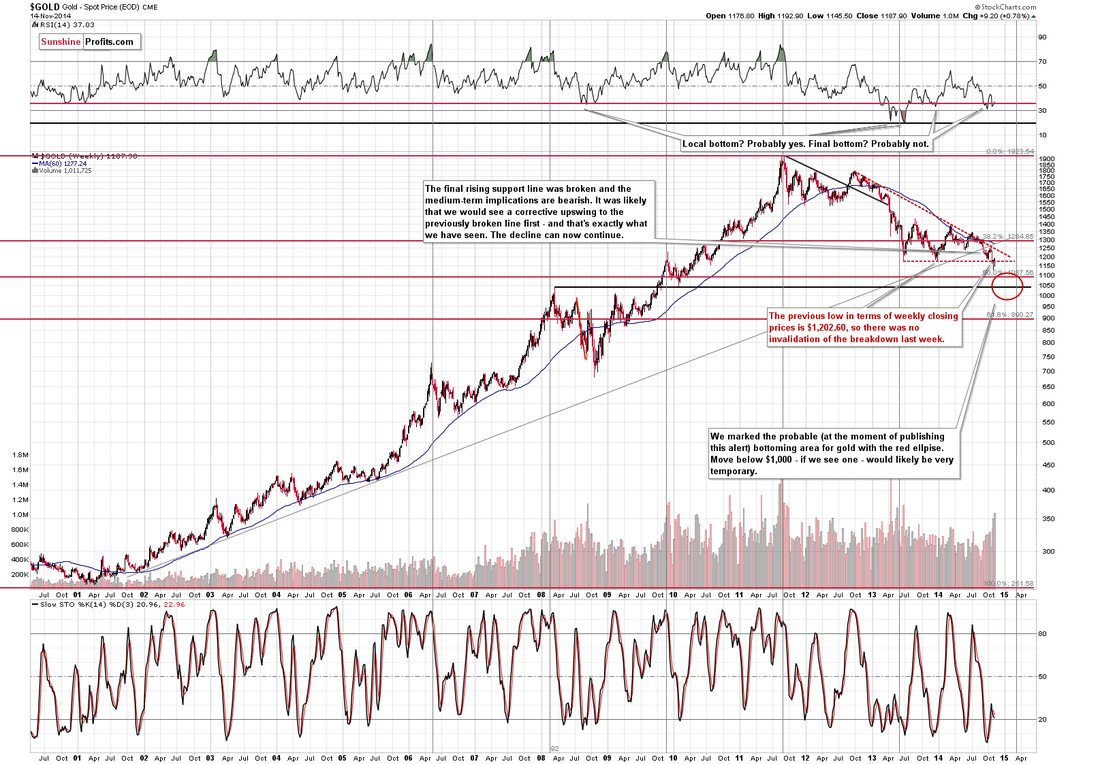
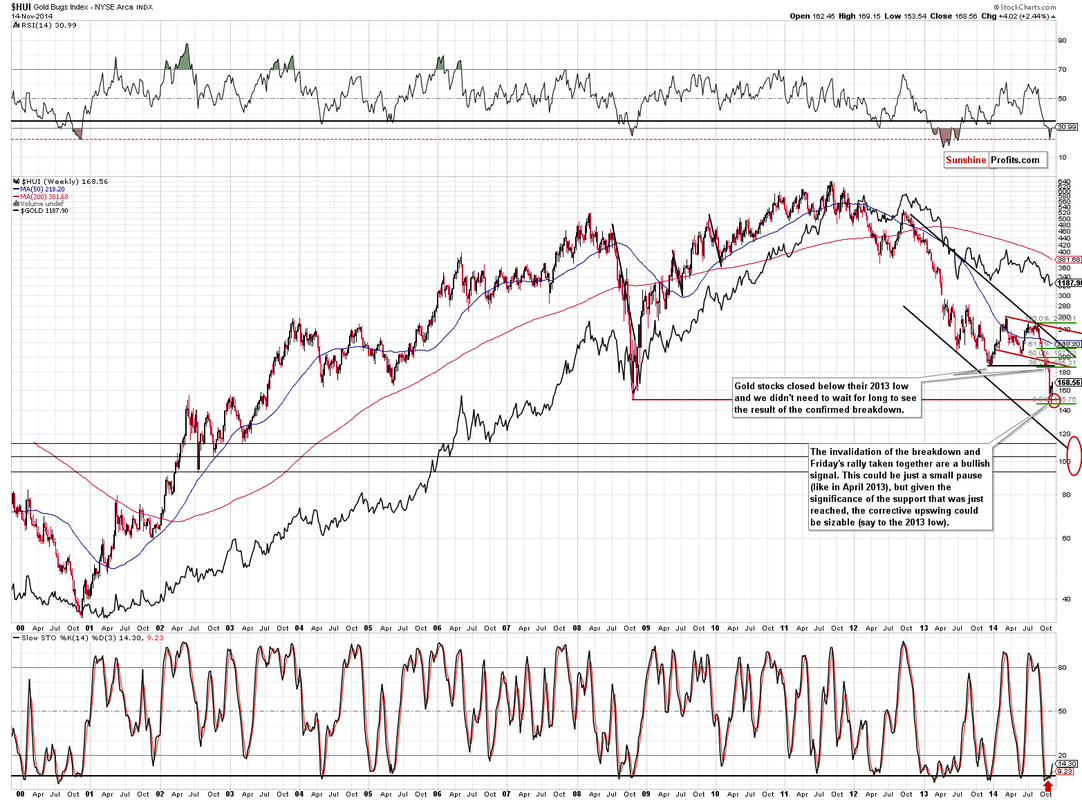
Resistance can be found at 1188, 1200, 1205, 1208, 1222, 1225, 1235, 1250, 1255, 1263, 1271-1273, 1290-1292, 1300-1302, 1310-1312, 1322-1325, 1333-1335 and 1345.  A second failure to break through the key 65 week MA confirms that the intermediate down trend is intact and the break of 1180 suggests the bears are in full control.

Today's video for subscribers looks at the recent trading in more detail and our strategy for our current short position.
0 Comments

Gold Market Update - 26th Nov

26/11/2014

0 Comments

 
LONG TERM TREND:                  BEARISH
INTERMEDIATE TERM TREND:    BEARISH
SHORT TERM TREND:                NEUTRAL/BEARISH
VERY SHORT TERM TREND:      NEUTRAL

Gold has continued to drift higher in a bearish rising wedge pattern over the past couple of weeks, following the sharp decline below 1180 that saw gold fall as low as 1131 before finding support.

The rally appears to be a counter trend corrective rally, as it is choppy and overlapping with little strength behind the move.  This contrasts markedly with the decline to 1131 which was clearly impulsive in nature.

The story remains the same - continuing strength in equities and the dollar, a weak oil price and no inflation.  Gold is always going to struggle in this environment and we maintain our stance that there is little reason to hold gold at present.  We expect the down trend to resume imminently.

Support can be found at 1193, 1190, 1180-1183, 1175-1178, 1154, 1145-1147, 1131, 1124, 1100, 1085, 1045 and 1000 . The break of 1180 has serious bearish implications for gold and suggests a decline to 1000-1050 in the short term, unless gold can hold above this level and build a base to move higher.

Resistance can be found at 1205, 1208, 1222, 1225, 1235, 1250, 1255, 1263, 1271-1273, 1290-1292, 1300-1302, 1310-1312, 1322-1325, 1333-1335 and 1345.  A second failure to break through the key 65 week MA confirms that the intermediate down trend is intact and the break of 1180 suggests the bears are in full control.

Today's video for subscribers looks at the recent trading in more detail and our strategy for our current short position.
0 Comments

Gold & Silver Trading Alert: Invalidation of Platinum’s Breakout

26/11/2014

0 Comments

 
Gold & Silver Trading Alert originally published on November 25th, 2014 6:07 AM: 

Briefly: In our opinion no speculative positions are currently justified from the risk/reward perspective. 

Yesterday was a day when the precious metals market took a breather, but it’s not true that nothing changed at all. Friday’s breakout in platinum was invalidated. Is this a “short again” signal? 

In short, not really, because this signal – even though it’s bearish – is not enough to make the situation very bearish on its own. 

As usual, let’s start today’s analysis with the USD Index (charts courtesy of http://stockcharts.com).
Picture
Not much changed from the short-term perspective, as the USD Index simply corrected some of its Friday’s rally and we didn’t see a breakout or breakdown from the flag pattern. Consequently, our yesterday’s comments remain up-to-date: 

The USD Index moved visibly higher on Friday, breaking out of the triangle pattern. The implications are bullish but not strongly bullish, as the pattern started to resemble more of a flag than a triangle. Since the flag pattern was not broken, many traders probably thought that the situation hadn’t changed. This could explain the lack of response in the precious metals market. If we saw a strong breakout and metals didn’t react, then it would definitely be a sign of strength, but at this time, it could be the case that the market participants are still not viewing the dollar’s move as a something real. 

(…)

The downside is limited in case of a breakdown, and the upside is visibly higher in case of a breakout. If we see a move similar to the one that preceded the recent consolidation, then we could see a move close to the 89 level that would materialize in the first part of December. This scenario seems quite likely also given the resistance line that would be reached (it would simply “fit”) and the cyclical turning point – we are likely to see at least a local top close to it. 

We could see a small move lower before the rally starts, though. This means that the above doesn’t invalidate our previous outlook and price targets for the precious metals sector.
Picture
The above long-term chart should help in keeping things in perspective. As you can see, the next resistance level is very close – slightly above the 89 level. However, what’s also important is that if the USD Index moves even higher (for instance based on the expectation that the Fed will be hiking interest rates soon), it won’t be likely to move much higher, as the next significant resistance is just below the 90 level and it’s the 38.2% Fibonacci retracement level based on the entire 2002 – 2008 decline. Until the USD Index reaches at least the 89 level, the precious metals market will be likely to move lower based on the dollar’s future strength. However, if USD manages to rally to 89.8 or so and at that time gold is at one of the strong support levels, then we might consider speculative long positions in the precious metals sector. Would this be the final bottom for the precious metals market? It’s too early to say at this time – we will be looking for confirmations in other markets and ratios and report accordingly.

As basically nothing changed in the silver market (and what we wrote yesterday remains up-to-date) and changes are very similar in gold and mining stocks, we will comment on the last 2 markets simultaneously.
Picture
Picture
Both gold and mining stocks moved a bit lower yesterday and the move materialized on low volume. This doesn’t have meaningful implications as low volume during declines is something natural. High volume could confirm that the next decline is starting, but we saw no such thing.  

Consequently, our yesterday’s comments on gold remain up-to-date: 

(…) we can see that gold moved to the lower of our upside target levels. This level is created by the 61.8% Fibonacci retracement level and the 50-day moving average. The last time gold touched its 50-day MA, it was one day ahead of the top.  

The implications of the above are bearish, but at this time we can’t rule out another $20 or so move higher, which would take gold to the declining resistance line.  

Since gold moved higher along with the USD, we could very well see a further upswing (if the USD declines at least a bit), but if the USD breaks above the flag pattern, then gold will likely decline right away. 

What about platinum?
Picture
0 Comments

Gold Market Update - 24th Nov

24/11/2014

0 Comments

 
LONG TERM TREND:                  BEARISH
INTERMEDIATE TERM TREND:    BEARISH
SHORT TERM TREND:                NEUTRAL/BEARISH
VERY SHORT TERM TREND:      BULLISH

Gold had another positive week last week, trading as high as 1207 and testing both the 61.8% retracement of the recent decline and the 50 DMA.  The rally has been choppy and overlapping and is likely to be corrective in nature rather than the beginning of a new bull run - with the price finding resistance at the confluence of the 50 DMA and 61.8% Fib level, we would not be surprised to see the decline resume from here.

The dollar continues to power higher alongside equities, with oil remaining weak - inflation expectations are at rock bottom with the gradually recovering world economy signalling interest rate rises next year.  This combination is very bearish for gold and there appears to be little reason to buy gold at these levels.

Support can be found at 1193, 1180-1183, 1175-1178, 1154, 1145-1147, 1131, 1124, 1100, 1085, 1045 and 1000 . The break of 1180 has serious bearish implications for gold and suggests a decline to 1000-1050 in the short term, unless gold can hold above this level and build a base to move higher.

Resistance can be found at 1205, 1208, 1222, 1225, 1235, 1250, 1255, 1263, 1271-1273, 1290-1292, 1300-1302, 1310-1312, 1322-1325, 1333-1335 and 1345.  A second failure to break through the key 65 week MA confirms that the intermediate down trend is intact and the break of 1180 suggests the bears are in full control.

Today's video for subscribers looks at the recent trading in more detail and our strategy for our current short position.
0 Comments

Gold Market Update - 19th Nov

19/11/2014

0 Comments

 
LONG TERM TREND:                  BEARISH
INTERMEDIATE TERM TREND:    BEARISH
SHORT TERM TREND:                NEUTRAL/BEARISH
VERY SHORT TERM TREND:      BULLISH

Gold has rebounded from the 1130 lows a couple of weeks ago, printing two bullish "hammer" candlesticks on the weekly chart and testing the 50 DMA at 1205 yesterday.  However, the down trend remains in force and we consider this rally to be a counter trend move, with the down trend likely to re-establish itself shortly.

The rally from 1130 has been choppy and overlapping rather than impulsive, suggesting that it is corrective in nature, tracing out a classic ABC pattern and retracing 61.8% of the recent decline.

Equities remain well supported and near to all time highs, oil continues to plummet along with inflation expectations and the dollar rally shows no sign of stopping.  This all adds up to a weak environment for gold, with the technicals adding weight to the bearish case.

Support can be found at 1180-1183, 1175-1178, 1154, 1145-1147, 1131, 1124, 1100, 1085, 1045 and 1000 . The break of 1180 has serious bearish implications for gold and suggests a decline to 1000-1050 in the short term, unless gold can hold above this level and build a base to move higher.

Resistance can be found at 1200, 1205, 1217, 1225, 1235, 1250, 1255, 1263, 1271-1273, 1290-1292, 1300-1302, 1310-1312, 1322-1325, 1333-1335 and 1345.  A second failure to break through the key 65 week MA confirms that the intermediate down trend is intact and the break of 1180 suggests the bears are in full control.

Today's video for subscribers looks at the recent trading in more detail and our strategy for our current short position.
0 Comments

Gold & Silver Trading Alert: Gold and Miners Soar on Huge Volume

18/11/2014

0 Comments

 
Gold & Silver Trading Alert originally published on November 17th, 2014 7:10 AM:

Briefly: In our opinion no speculative positions are currently justified from the risk/reward perspective.

Gold moved substantially higher on Friday and the volume was huge. The session was both significant and bullish, but the question remains if such show of strength can be a start of the next big move. As we promised in Friday’s second alert, we analyzed the situation thoroughly over the weekend and are reporting to you today.

Let’s jump right into charts (charts courtesy of http://stockcharts.com).

First of all, let’s take a look at something that didn’t change – the situation in the USD Index.
Picture
The Index remains in the triangle pattern. The important thing to keep in mind is the intra-day attempt to break above the upper border of the pattern, which was invalidated shortly thereafter.

If the USD Index breaks down from the triangle patter, it’s not likely to fall much further – there are short-term support levels at the Oct. high and the rising black support line. We don’t expect the USD Index to move visibly below the 86.4 - 87 area. We would expect the rally to resume after this area is reached.

On the other hand, if the USD Index does indeed rally right away, then it could move much higher before it really tops (above 89).

Theoretically, this means that gold has limited short-term upside and bigger downside. Does it?
Picture
The significant downside is definitely present, as there was no move above the declining (red, dashed) resistance line and gold didn’t close the week above the previous 2013 low (in terms of weekly closing prices).
Picture
On the short-term chart we see that gold corrected to another important retracement level – the 50% one. Is it enough to stop the rally? It’s certainly possible, but after such a sizable daily rally on strong volume, we can expect some more strength in the coming day(s). So, how high can gold go? To the following resistance levels, of course. The next one is the 61.8% Fibonacci retracement, and a bit higher we have the declining short-term resistance line. It seems likely to us that one of them will stop the rally, as they more or less correspond to the support levels in the USD Index. Which of them is more likely? It’s a touch call at this time – it seems that focusing on other markets / ratios and waiting for a confirmation is a good idea at this time.

Speaking of ratios – can the gold:USD Index ratio tell us something?
Picture
Yes, but that’s generally a confirmation of what we’ve already written above – that gold could move a bit higher before it continues to slide. In this case, we would see a move back to the previously broken horizontal support and then a continuation of the decline.
Picture
From the non-USD perspective, we have no decisive signal. On one hand we’ve just seen a weekly reversal on strong volume, which is a bullish sign, but on the other hand we’ve just seen another move back to the previously broken rising support/resistance line (the breakdown was not invalidated, so the implications remain bearish).  

Let’s move to silver.
Picture
From the long-term perspective, the consolidation seems to continue, which is in tune with what we saw in April 2013. The analogy to this month has bearish implications as back then declines followed. Please note that silver spent a few weeks trading back and forth before its decline continued, so just because silver is not moving lower again is not concerning.
Picture
In Friday’s first alert, we wrote the following:

By opening short positions now, we would risk being thrown out of them if PMs rallied temporarily and sharply before declining again. Please recall that silver has been known for such counter-trend rallies right before plunging.

On the short-term SLV ETF chart we see that the rally was very significant on a daily basis. It was definitely good to watch this from the sidelines instead of keeping a short position open. Silver moved to the 20-day moving average, but does it mean that silver can’t move higher? It could – it’s currently correcting a huge decline, so we wouldn’t be surprised to see a move even higher – to the declining resistance line – before the upswing is over. Please note that in October silver also moved temporarily above the 20-day moving average only to decline shortly thereafter.
Picture
Examining silver from the non-USD perspective provides us with the same outcome as the analysis of the gold charts. Namely, the corrective upswing is likely not over yet, but it’s not likely to take metals much higher either. 

Let’s take a look at gold stocks.
Picture
Gold miners have their resistance level relatively high, but since they are ones that have recently dropped particularly significantly, it’s no wonder that the correction is also big. Our comments from the Nov. 10 alert remain up-to-date: 

Gold stocks moved higher last week after reaching our initial target area but that’s no proof that the decline is completely over. During the 2008 decline there were sharp corrective upswings as well, but they didn’t mean that the decline was over. The current decline has been significant, so a corrective upswing (a pause within the decline) would be something normal. 

How high could gold stocks go before the decline is resumed? It’s a tough call as the market has been very volatile lately, but at this time we wouldn’t rule out a move back to the previously broken support at the 2013 low. The 38.2% Fibonacci retracement based on the recent decline is very close to it, so it seems quite likely that the 185-190 level would stop a rally.  

Junior miners can also tell us something (more precisely, their performance relative to other stocks).
Picture
The above chart features the GDXJ to SPY ratio, which means that it will move higher when juniors rally faster than the general stock market. The volume is actually the ratio of volumes. The things that are particularly interesting are situations when we see sudden spikes in the volume (a ratio of volumes). This is when juniors are a particularly “hot topic” – of course on a relative basis. The useful tendency is that these times very often precede or mark important price tops in the precious metals sector. The spikes that we saw in the last 2 weeks were historically high. They were so huge that they made the spikes seen before 2013 barely visible on the above chart. Consequently, the bearish medium-term implications are clearly in place and based on them we could expect another downswing soon, but not necessarily right away. This is in tune with what we concluded based on the analysis of the previous charts. 

Summing up, the precious metals sector continues to correct its recent downswing, while remaining in the medium-term downtrend, and it seems that it will move a bit higher before turning south again. 

As always, we will continue to monitor the situation and report to you – our subscribers – accordingly. We will aim to multiply the recent profits and will quite likely open another trading position shortly – stay tuned. 

To summarize: 

Trading capital (our opinion): No positions 

Long-term capital (our opinion): No positions 

Insurance capital (our opinion): Full position 

You will find details on our thoughts on gold portfolio structuring in the Key Insights section on our website. 

As always, we'll keep our subscribers updated should our views on the market change. We will continue to send them our Gold & Silver Trading Alerts on each trading day and we will send additional ones whenever appropriate. If you'd like to receive them, please subscribe today. 

We were bullish on gold as far medium-term is concerned for the vast majority of the time until April 2013. After that we have generally been expecting lower prices. Are we gold bears? No - we view this decline as lengthy, but temporary. We expect gold to rally in the coming years, but instead of following the buy-and-hold approach, we exit the long-term precious investments at the most unfavorable times and re-enter when things look good again, thus saving a lot of money. Additionally, our Gold & Silver Trading Alerts help you profit from the short-term price swings. We invite you to examine our premium services and encourage you to sign up for our free mailing list today. 

Thank you. 

Przemyslaw Radomski, CFA

Founder, Editor-in-chief

Tools for Effective Gold & Silver Investments - SunshineProfits.com

Tools für Effektives Gold- und Silber-Investment - SunshineProfits.DE 


* * * * *
Disclaimer
All essays, research and information found above represent analyses and opinions of Przemyslaw Radomski, CFA and Sunshine Profits' associates only. As such, it may prove wrong and be a subject to change without notice. Opinions and analyses were based on data available to authors of respective essays at the time of writing. Although the information provided above is based on careful research and sources that are believed to be accurate, Przemyslaw Radomski, CFA and his associates do not guarantee the accuracy or thoroughness of the data or information reported. The opinions published above are neither an offer nor a recommendation to purchase or sell any securities. Mr. Radomski is not a Registered Securities Advisor. By reading Przemyslaw Radomski's, CFA reports you fully agree that he will not be held responsible or liable for any decisions you make regarding any information provided in these reports. Investing, trading and speculation in any financial markets may involve high risk of loss. Przemyslaw Radomski, CFA, Sunshine Profits' employees and affiliates as well as members of their families may have a short or long position in any securities, including those mentioned in any of the reports or essays, and may make additional purchases and/or sales of those securities without notice.
0 Comments

Gold Market Update - 13th Nov

13/11/2014

0 Comments

 
LONG TERM TREND:                  BEARISH
INTERMEDIATE TERM TREND:    BEARISH
SHORT TERM TREND:                BEARISH
VERY SHORT TERM TREND:      NEUTRAL

Gold has consolidated in a triangle pattern following last week's sharp losses and is coiling for the next big move.  We suspect that the downside is not over yet, by any stretch, however we don't expect the sell off to be as severe as in April 2013.

The triangle pattern is getting close to a resolution, with a breakout expected this week.  Equities remain well supported and near all time highs, oil remains weak and the dollar is strong near multi-year highs.

Support can be found at 1154, 1145, 1131, 1124, 1100, 1085, 1045 and 1000 . The break of 1180 has serious bearish implications for gold and suggests a decline to 1000-1050 in the short term.

Resistance can be found at 1164, 1168-1170, 1178-1180, 1202, 1217, 1225, 1235, 1250, 1255, 1263, 1271-1273, 1290-1292, 1300-1302, 1310-1312, 1322-1325, 1333-1335 and 1345.  A second failure to break through the key 65 week MA confirms that the intermediate down trend is intact and the break of 1180 suggests the bears are in full control.

Today's video for subscribers looks at the recent trading in more detail and our strategy for our current short position.
0 Comments

Gold Market Update - 11th Nov

11/11/2014

0 Comments

 
LONG TERM TREND:                  BEARISH
INTERMEDIATE TERM TREND:    BEARISH
SHORT TERM TREND:                BEARISH
VERY SHORT TERM TREND:      NEUTRAL

Gold rallied strongly on Friday after a weaker than expected Non Farm Payrolls number, surging from a low of 1131 to close at 1178, just below the key 1180 resistance level.
  This rally took the yellow metal to an exact 38.2% retracement level of the recent decline on Friday.

This price action resulted in a bullish "hammer" candlestick on the weekly chart and an equally bullish "three river morning star" on the daily chart, however as we have seen so many times in the past (and particularly this year) with "knee jerk" moves driven by news releases, the market sold off steadily all day yesterday to invalidate the bullish chart patterns.

The bears are now fully in control and the failure to break 1180 on the retest will give them confidence to press the price lower, with a target of 1050 the likely aim.  The dollar rally appears to be gathering strength as it breaks through 88 and equities remain the "go to" investment class with the bull run end nowhere in sight.

Support can be found at 1145, 1131, 1124, 1100, 1085, 1045 and 1000 . The break of 1180 has serious bearish implications for gold and suggests a decline to 1000-1050 in the short term.

Resistance can be found at 1157, 1178-1180, 1202, 1217, 1225, 1235, 1250, 1255, 1263, 1271-1273, 1290-1292, 1300-1302, 1310-1312, 1322-1325, 1333-1335 and 1345.  A second failure to break through the key 65 week MA confirms that the intermediate down trend is intact and the break of 1180 suggests the bears are in full control.

Today's video for subscribers looks at the recent trading in more detail and our strategy for our current short position.
0 Comments

Gold & Silver Trading Alert: Gold and Miners Soar on Huge Volume

11/11/2014

0 Comments

 
Gold & Silver Trading Alert originally published on November 10th, 2014 8:49 AM:

Briefly: In our opinion no speculative positions are currently justified from the risk/reward perspective. In other words, closing short positions and taking profits off the table seems justified.

Much happened on Friday in gold and mining stocks and the key question is this: does this strength prove that the bottom is in? Our take is that it suggests that “a bottom” might be in, but “the bottom” is likely still ahead of us.

Let’s take a look at the charts, starting with the USD Index (charts courtesy of http://stockcharts.com).
Picture
On Friday we wrote the following:

The USD Index is after a major breakout and there is no strong resistance level until about 89. This means that the USD Index is likely to rally for another 1 – 1.5 before the top is in. In other words, the USD Index has room for further gains and gold seems to have room for further declines.

The above hasn’t changed even though the USD Index declined a bit on Friday. It didn’t reach an important resistance level before Friday’s decline and the move above the previous 2014 high is confirmed. Consequently, it’s likely that the rally will continue until the USD Index reaches at least the 2010 high, and more likely the 2009 high.

This gives us significant room for a further rally – and a further decline in gold.
Picture
On Friday, however, gold moved higher on strong volume, which is a bullish sign. Gold didn’t manage to close the week above the 2013 low, so the breakdown below it was not invalidated – which in turn is a bearish sign. Moreover, gold corrected to the 38.2% Fibonacci retracement, which means 2 things. Firstly, the current move is still down - until we see a move above the 61.8% retracement the rally will be a correction, not necessarily a beginning of a bigger upswing, and gold hasn’t even moved above the lower retracement of 38.2%. Secondly, the rally could be already over as the resistance was reached.

Overall, gold’s price/volume action that we saw on Friday was less bullish than it seemed to be. Still, the short-term situation is now more bullish than it was before Friday’s session.
Picture
In the case of the gold to USD Index ratio, we see that the breakdown below the 2013 low was definitely not invalidated, but we also see that gold hasn’t moved back to it (or any other significant resistance level), so it’s wouldn’t be surprising if Friday’s rally were to be followed by another move higher.
Picture
From the non-USD perspective, gold has moved back to the support level, but not above it. This makes a subsequent decline quite likely. On the other hand, the candlestick based on the last week price changes is a hammer, which signals a reversal. Overall, the short-term outlook is rather unclear based on the above chart.
Picture
Silver reversed as well, but overall ended the week more than 2% lower. The strong support levels and our target area were not reached and it doesn’t seem that the decline is over, but a pause is not out of the question, especially that the RSI indicator shows that silver is extremely oversold.  

Speaking of the RSI, there was a situation in the past similar to the current one. In April 2013 silver corrected part of its previous decline when the RSI was similarly oversold. Please note that back then the white metal declined once again after a few weeks and silver didn’t rally significantly during the pause. It seems quite likely that we will see something similar also this time. However, the pause may not be that long as we are quite likely in the final part of the entire decline that started in 2011, and the final stages of a given move tend to be rather sharp – especially in the case of silver. 
Picture
Gold stocks moved higher last week after reaching our initial target area but that’s no proof that the decline is completely over. During the 2008 decline there were sharp corrective upswings as well, but they didn’t mean that the decline was over. The current decline has been significant, so a corrective upswing (a pause within the decline) would be something normal.

How high could gold stocks go before the decline is resumed? It’s a tough call as the market has been very volatile lately, but at this time we wouldn’t rule out a move back to the previously broken support at the 2013 low. The 38.2% Fibonacci retracement based on the recent decline is very close to it, so it seems quite likely that the 185-190 level would stop a rally.

Before summarizing, let’s take a look at one additional chart that suggests that a corrective upswing is to be expected.
Picture
The gold stocks to gold ratio moved to its 2000 low, which is a major support level. This doesn’t necessarily mean that the final bottom is in, but it does make a corrective upswing more likely.

Our previous comments on the ratio remain up-to-date:

The gold stocks to gold ratio moved to a major support level – the 2000 low. In other words, if someone purchased gold stocks (on average) at the 2000 bottom in order to multiply gold’s gains and someone else just bought gold, they would both have the same amount of money at this time.

As you may recall, the HUI to gold ratio at its 2000 bottom is one of the things that we were expecting to see as the final bottom confirmation. However, at this time there are not enough additional signs to change the overall outlook (based on the silver to gold ratio, for example, we are likely to see further declines).

Can the above chart not mean that the final bottom is in? Yes. There were generally 2 cases, when the ratio dropped sharply and approached important (not as important as this one, but still), long-term support levels: in 2008 and in early 2013. In both cases the previous lows didn’t stop the decline. In 2008 there was a small move below the support level before gold stocks rallied again and in early 2013 there was only a corrective upswing to the 2008 low that verified the breakdown – declines followed.

Summing up, the final bottom is most likely not yet in, but there are some signs that point to further increases in the very short term (several days). Not all signs, however, suggest strength in the short run – there are some that suggest further declines (gold below the 2013 low and non-USD gold below the rising support/resistance line). The situation was not as clear on Friday, as it is now, as we now have the final weekly price changes and weekly closing prices. All in all, the outlook for the next few weeks remains unchanged and bearish (we are likely to see lower gold, silver and mining stock values), but the outlook for the next week or so is a bit unclear. Consequently, it seems that waiting on the sidelines for either a bearish or bullish confirmation is a good idea now. In other words, we think that taking profits off the table is a good idea at this time. The odds favor a move lower, but the risk associated with keeping a short position at this time seems too high.

We opened short positions on Oct. 27 (based on the previous trading day’s closing prices of $1,231.20 in gold, $17.18 in silver, and 184.39 in the HUI Index) and we doubled them on Oct. 30. The profits on this 2-week long short position are sizeable, especially in the case of silver (the white metal declined more than $1.50). Of course, it would be even better to get out at the exact bottom, but that’s simply not something that can be done each and every time (we had exited the previous long position based on the Oct. 21 closing prices, which was the top, though).

As always, we will continue to monitor the situation and report to our subscribers accordingly. We will quite likely open another trading position shortly – stay tuned.

To summarize:

Trading capital (our opinion): No positions

Long-term capital (our opinion): No positions

Insurance capital (our opinion): Full position

You will find details on our thoughts on gold portfolio structuring in the Key Insights section on our website.

As always, we'll keep our subscribers updated should our views on the market change. We will continue to send them our Gold & Silver Trading Alerts on each trading day and we will send additional ones whenever appropriate. If you'd like to receive them, please subscribe today.

We were bullish on gold as far medium-term is concerned for the vast majority of the time until April 2013. After that we have generally been expecting lower prices. Are we gold bears? No - we view this decline as lengthy, but temporary. We expect gold to rally in the coming years, but instead of following the buy-and-hold approach, we exit the long-term precious investments at the most unfavorable times and re-enter when things look good again, thus saving a lot of money. Additionally, our Gold & Silver Trading Alerts help you profit from the short-term price swings. We invite you to examine our premium services and encourage you to sign up for our free mailing list today.

Thank you.

Przemyslaw Radomski, CFA

Founder, Editor-in-chief

Tools for Effective Gold & Silver Investments - SunshineProfits.com

Tools für Effektives Gold- und Silber-Investment - SunshineProfits.DE
 

* * * * *
Disclaimer
All essays, research and information found above represent analyses and opinions of Przemyslaw Radomski, CFA and Sunshine Profits' associates only. As such, it may prove wrong and be a subject to change without notice. Opinions and analyses were based on data available to authors of respective essays at the time of writing. Although the information provided above is based on careful research and sources that are believed to be accurate, Przemyslaw Radomski, CFA and his associates do not guarantee the accuracy or thoroughness of the data or information reported. The opinions published above are neither an offer nor a recommendation to purchase or sell any securities. Mr. Radomski is not a Registered Securities Advisor. By reading Przemyslaw Radomski's, CFA reports you fully agree that he will not be held responsible or liable for any decisions you make regarding any information provided in these reports. Investing, trading and speculation in any financial markets may involve high risk of loss. Przemyslaw Radomski, CFA, Sunshine Profits' employees and affiliates as well as members of their families may have a short or long position in any securities, including those mentioned in any of the reports or essays, and may make additional purchases and/or sales of those securities without notice.
0 Comments

Gold Market Update - 5th Nov

5/11/2014

0 Comments

 
LONG TERM TREND:                  BEARISH
INTERMEDIATE TERM TREND:     BEARISH
SHORT TERM TREND:                BEARISH
VERY SHORT TERM TREND:        BEARISH

After crashing through 1180 on Friday, gold has consolidated near lows this week, however this morning the selling has resumed and gold is currently trading below 1150.

This move suggests that the break below 1180 is a valid breakdown and we can expect much lower prices in the next few weeks - our intial target is 1050 though we could easily see 1000 in short order.

Equities and the dollar are surging higher whilst oil collapses towards $75 - a perfect storm for lower gold prices.

Support can be found at 1145, 1124, 1100, 1085, 1045 and 1000 . The break of 1180 has serious bearish implications for gold and suggests a decline to 1000-1050 in the short term.

Resistance can be found at 1175, 1180, 1200, 1217, 1225, 1232, 1235, 1250, 1255, 1263, 1271-1273, 1290-1292, 1300-1302, 1310-1312, 1322-1325, 1333-1335 and 1345.  A second failure to break through the key 65 week MA confirms that the intermediate down trend is intact and the break of 1180 suggests the bears are in full control.

Today's video for subscribers looks at the recent trading in more detail and our strategy for our current trade.
0 Comments
<<Previous

    Old Posts

    August 2021
    July 2021
    June 2021
    May 2021
    March 2021
    February 2021
    January 2021
    December 2020
    November 2020
    March 2019
    January 2019
    December 2018
    October 2018
    September 2018
    August 2018
    July 2018
    June 2018
    May 2018
    March 2018
    February 2018
    July 2017
    June 2017
    May 2017
    April 2017
    March 2017
    February 2017
    January 2017
    December 2016
    July 2016
    March 2016
    December 2015
    November 2015
    October 2015
    September 2015
    August 2015
    July 2015
    June 2015
    May 2015
    April 2015
    March 2015
    February 2015
    January 2015
    December 2014
    November 2014
    October 2014
    September 2014
    August 2014
    July 2014
    June 2014
    May 2014
    April 2014
    March 2014
    February 2014
    January 2014
    December 2013
    November 2013
    October 2013
    September 2013
    August 2013
    July 2013
    June 2013
    May 2013
    April 2013
    March 2013
    February 2013
    January 2013
    December 2012
    November 2012
    October 2012
    September 2012
    August 2012
    July 2012
    June 2012
    May 2012
    April 2012
    March 2012
    February 2012
    January 2012
    December 2011
    November 2011
    October 2011

UK Gold Trading Experts (UKGTE) is a trading name of Drupac Limited, a company registered in England and Wales (company number 09167819) whose registered office is 1 St. Paul's Square, Birmingham, B3 1QU.