Gold Trading Alert originally published on August 27th, 2015 7:03 AM:
Briefly: In our opinion, short (full) speculative positions in gold, silver and mining stocks are justified from the risk/reward point of view.
Yesterday we saw another big daily decline and it served as an additional confirmation that taking profits on long positions and entering short ones on Monday, at 2PM (when the GDX was at $15) had been a good idea. Will the short positions become more profitable in the future?
The only honest answer to this kind of question is “we don’t know”, but we do think that it’s very likely. The reason is the combination of several technical factors, the similarity to October 2014 and the way the precious metals perform relative to the USD Index. Let’s start with the former by looking at the charts (charts courtesy of http://stockcharts.com).
In Tuesday’s alert we wrote the following:
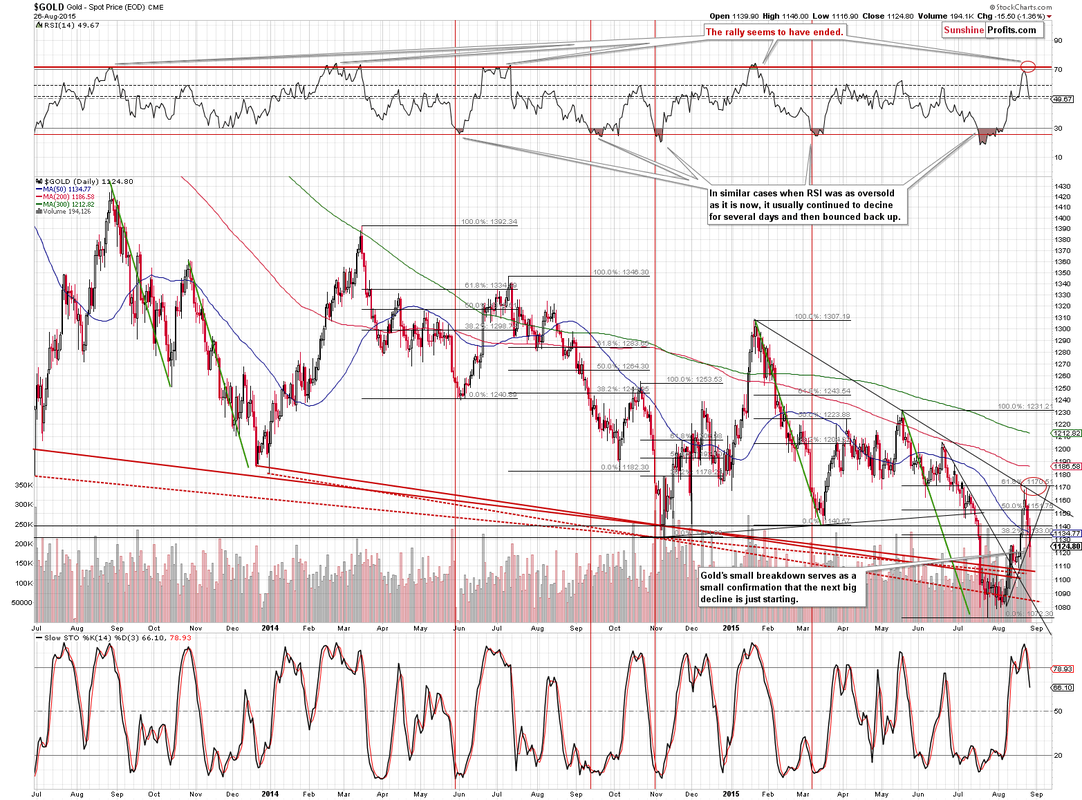
(…) more significant resistance levels remain just above where gold is right now. The 61.8% Fibonacci retracement and the declining resistance line coincide at about $1,170, which is our current target for the yellow metal.
(…)
Gold moved to $1,169.80, so effectively it moved to the mentioned target level, before declining. More importantly, it declined on huge volume, which is a very bearish sign. Moreover, we saw a sell signal from the Stochastic indicator and it very often corresponded to major local tops in the past. The implications are bearish.
Gold has indeed declined in the past few days and the decline took place on big volume – which serves as a bearish confirmation. Moreover, gold broke (insignificantly, but still) below the short-term rising support line. The outlook remains bearish.
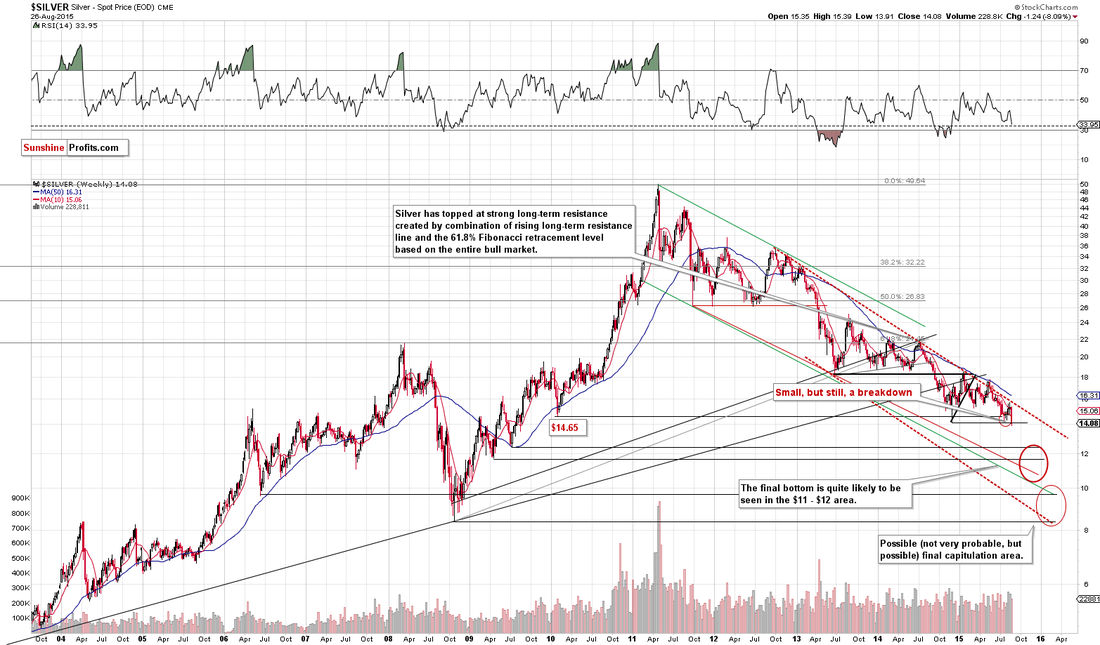
Speaking of breakdowns, silver just broke below the major support in the form of the 2014 low. Remember when “everyone” (at least many precious metals analysts) wrote that the final bottom in silver had been formed back in November 2014, but we didn’t? Well, the theory that the final bottom was behind us was just proven incorrect.
The implications of yesterday’s move are not yet very bearish, but will likely soon become such. The reason is that the breakdown has not been verified just yet. The support is significant, so the breakdown could easily be invalidated, so it’s better to wait for additional several closes below the 2014 low and a weekly close. All in all, the situation deteriorated based on yesterday’s decline, but not significantly so.
The implications of yesterday’s move are not yet very bearish, but will likely soon become such. The reason is that the breakdown has not been verified just yet. The support is significant, so the breakdown could easily be invalidated, so it’s better to wait for additional several closes below the 2014 low and a weekly close. All in all, the situation deteriorated based on yesterday’s decline, but not significantly so.
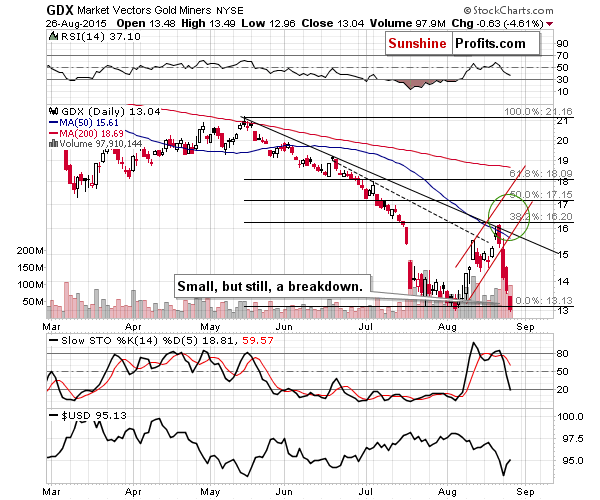
We can say exactly the same about the above GDX chart as we saw a very similar pattern, only from the short-term perspective:
The implications of yesterday’s move are not yet very bearish, but will likely soon become such. The reason is that the breakdown was not verified just yet. (…) All in all, the situation deteriorated based on yesterday’s decline, but not significantly, so
The implications of yesterday’s move are not yet very bearish, but will likely soon become such. The reason is that the breakdown was not verified just yet. (…) All in all, the situation deteriorated based on yesterday’s decline, but not significantly, so
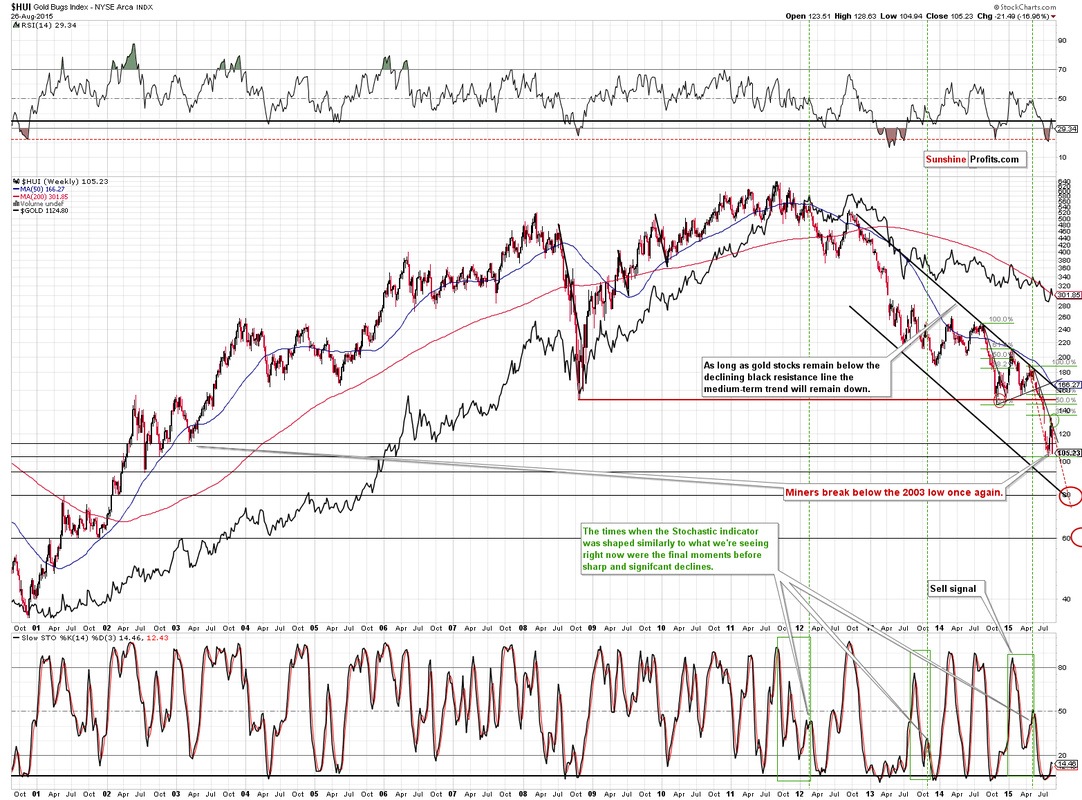
The above HUI Index (proxy for gold stocks) chart has the same implications, but it’s particularly interesting in light of the size of the decline in miners and metals. Namely, if gold and silver are likely to decline significantly (note the targets in the silver chart), then it’s very likely that mining stocks will decline significantly as well.
Miners are already very oversold from the long-term point of view, but it seem that they will need to become extremely oversold before the final bottom is seen. That’s just how the markets work – moving from excessive optimism to excessive pessimism and vice-versa. If miners are to decline significantly, then how low can they go? To the lower support levels, and the 2001 high and the late-2001 low seem low enough for the decline in miners to correspond to the big declines in gold and silver that we expect to see in the following months.
All in all, many technical factors point to lower prices, but, as mentioned earlier today, there’s more. The analogy to October 2014 is also a very bearish factor. We described it on Monday in the following way (and it remains up-to-date also today as the analogy continues):
Today’s session is very volatile, not only in case of the general stock market and the USD Index, but also in some parts of the precious metals market, and it’s a good example that a lot can change in a relatively short period.
Today’s session is definitely a significant one as there are not many cases when stocks and USD plunge sharply at the same time. Since it’s likely important, it’s also important that we check what is the likely impact on the precious metals sector.
As mentioned above, there were not many similar days to what we saw today on the stock market, but there is one day that is definitely similar. On Oct 15 2014 the S&P 500 declined significantly (after a big slide) and reversed in a major way. It was not the final bottom, but a day ahead of it. It looked very (!) similar to what we’re seeing today.
What happened on other markets? Was the session at least somewhat similar in them as well? Not only somewhat, but very.
That was a few days before gold’s local top and before a great shorting opportunity.
Silver was not outperforming before this local top, but there was significant intra-day volatility at that time. We’re seeing something similar also today and in the past few days.
After the initial sharp rally, mining stocks started to disappoint once again and Oct 15 2014 was a great day to be moving from long to short positions. Miners were rallying sharply recently, but started to underperform recently as well.
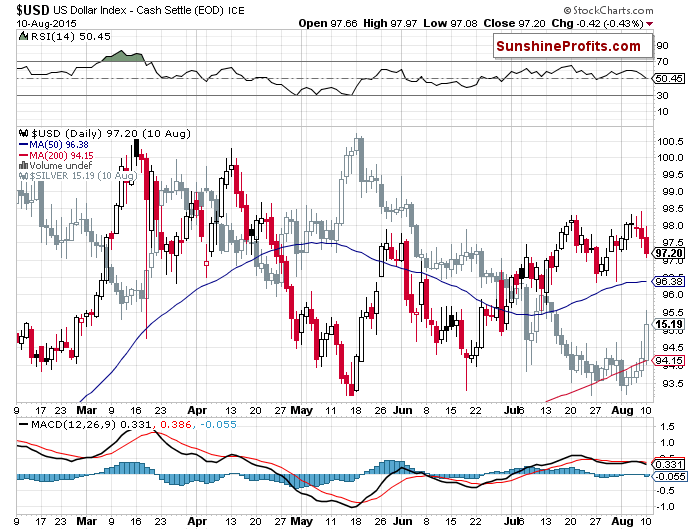
What did the USD do? It declined sharply to a significant support level (back then it was the 40-day moving average and right now the May and June 2015 lows serve as support - the USD Index moved temporarily below them but it’s once again above these levels at the moment of writing these words).
The implications of the above similarity are very bearish, and so is the precious metals sector decline despite a major slide in the USD Index.
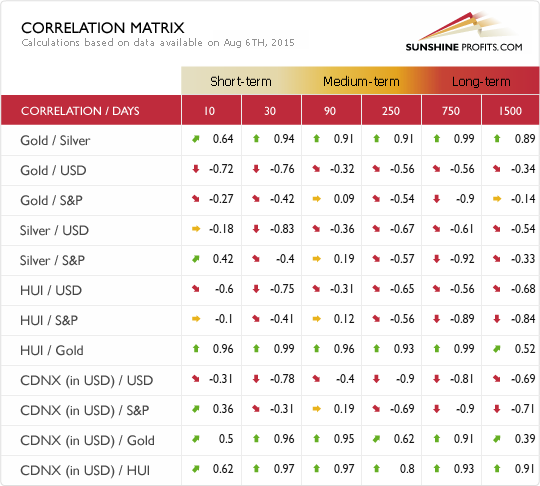
Speaking of gold’s underperformance relative to the action seen in the USD Index, the latter is basically unchanged this week (0.13% gain) despite the intra-week plunge, so one would expect gold to be more or less unchanged as well. Gold declined more than $35 this week. The underperformance is clear and it serves as another confirmation of the bearish outlook.
Summing up, we believe that the outlook for the precious metals market deteriorated once again yesterday. The analogy to the similar session (Oct. 15, 2014), gold’s underperformance relative to the USD Index, and other technical signs make us think (our opinion) that much lower prices are in the cards and that the short positions will become much more profitable than they already are.
To summarize:
Trading capital (our opinion): Short position (full) position in gold, silver and mining stocks is justified from the risk/reward perspective. Precise stop-loss orders and initial target prices are available to our subscribers.
Long-term capital (our opinion): No positions
Insurance capital (our opinion): Full position
You will find details on our thoughts on gold portfolio structuring in the Key Insights section on our website.
Thank you.
Przemyslaw Radomski, CFA
Founder, Editor-in-chief
Gold Investment & Silver Investment at SunshineProfits.com
* * * * *
Disclaimer
All essays, research and information found above represent analyses and opinions of Przemyslaw Radomski, CFA and Sunshine Profits' associates only. As such, it may prove wrong and be a subject to change without notice. Opinions and analyses were based on data available to authors of respective essays at the time of writing. Although the information provided above is based on careful research and sources that are believed to be accurate, Przemyslaw Radomski, CFA and his associates do not guarantee the accuracy or thoroughness of the data or information reported. The opinions published above are neither an offer nor a recommendation to purchase or sell any securities. Mr. Radomski is not a Registered Securities Advisor. By reading Przemyslaw Radomski's, CFA reports you fully agree that he will not be held responsible or liable for any decisions you make regarding any information provided in these reports. Investing, trading and speculation in any financial markets may involve high risk of loss. Przemyslaw Radomski, CFA, Sunshine Profits' employees and affiliates as well as members of their families may have a short or long position in any securities, including those mentioned in any of the reports or essays, and may make additional purchases and/or sales of those securities without notice.
Miners are already very oversold from the long-term point of view, but it seem that they will need to become extremely oversold before the final bottom is seen. That’s just how the markets work – moving from excessive optimism to excessive pessimism and vice-versa. If miners are to decline significantly, then how low can they go? To the lower support levels, and the 2001 high and the late-2001 low seem low enough for the decline in miners to correspond to the big declines in gold and silver that we expect to see in the following months.
All in all, many technical factors point to lower prices, but, as mentioned earlier today, there’s more. The analogy to October 2014 is also a very bearish factor. We described it on Monday in the following way (and it remains up-to-date also today as the analogy continues):
Today’s session is very volatile, not only in case of the general stock market and the USD Index, but also in some parts of the precious metals market, and it’s a good example that a lot can change in a relatively short period.
Today’s session is definitely a significant one as there are not many cases when stocks and USD plunge sharply at the same time. Since it’s likely important, it’s also important that we check what is the likely impact on the precious metals sector.
As mentioned above, there were not many similar days to what we saw today on the stock market, but there is one day that is definitely similar. On Oct 15 2014 the S&P 500 declined significantly (after a big slide) and reversed in a major way. It was not the final bottom, but a day ahead of it. It looked very (!) similar to what we’re seeing today.
What happened on other markets? Was the session at least somewhat similar in them as well? Not only somewhat, but very.
That was a few days before gold’s local top and before a great shorting opportunity.
Silver was not outperforming before this local top, but there was significant intra-day volatility at that time. We’re seeing something similar also today and in the past few days.
After the initial sharp rally, mining stocks started to disappoint once again and Oct 15 2014 was a great day to be moving from long to short positions. Miners were rallying sharply recently, but started to underperform recently as well.
What did the USD do? It declined sharply to a significant support level (back then it was the 40-day moving average and right now the May and June 2015 lows serve as support - the USD Index moved temporarily below them but it’s once again above these levels at the moment of writing these words).
The implications of the above similarity are very bearish, and so is the precious metals sector decline despite a major slide in the USD Index.
Speaking of gold’s underperformance relative to the action seen in the USD Index, the latter is basically unchanged this week (0.13% gain) despite the intra-week plunge, so one would expect gold to be more or less unchanged as well. Gold declined more than $35 this week. The underperformance is clear and it serves as another confirmation of the bearish outlook.
Summing up, we believe that the outlook for the precious metals market deteriorated once again yesterday. The analogy to the similar session (Oct. 15, 2014), gold’s underperformance relative to the USD Index, and other technical signs make us think (our opinion) that much lower prices are in the cards and that the short positions will become much more profitable than they already are.
To summarize:
Trading capital (our opinion): Short position (full) position in gold, silver and mining stocks is justified from the risk/reward perspective. Precise stop-loss orders and initial target prices are available to our subscribers.
Long-term capital (our opinion): No positions
Insurance capital (our opinion): Full position
You will find details on our thoughts on gold portfolio structuring in the Key Insights section on our website.
Thank you.
Przemyslaw Radomski, CFA
Founder, Editor-in-chief
Gold Investment & Silver Investment at SunshineProfits.com
* * * * *
Disclaimer
All essays, research and information found above represent analyses and opinions of Przemyslaw Radomski, CFA and Sunshine Profits' associates only. As such, it may prove wrong and be a subject to change without notice. Opinions and analyses were based on data available to authors of respective essays at the time of writing. Although the information provided above is based on careful research and sources that are believed to be accurate, Przemyslaw Radomski, CFA and his associates do not guarantee the accuracy or thoroughness of the data or information reported. The opinions published above are neither an offer nor a recommendation to purchase or sell any securities. Mr. Radomski is not a Registered Securities Advisor. By reading Przemyslaw Radomski's, CFA reports you fully agree that he will not be held responsible or liable for any decisions you make regarding any information provided in these reports. Investing, trading and speculation in any financial markets may involve high risk of loss. Przemyslaw Radomski, CFA, Sunshine Profits' employees and affiliates as well as members of their families may have a short or long position in any securities, including those mentioned in any of the reports or essays, and may make additional purchases and/or sales of those securities without notice.