UK Gold Trading Experts
  • Home
  • Trade Like a Pro
  • Gold Blog
  • Subscriber Resources
  • Legal Stuff
    • User Agreement
  • Contact Us

Gold Market Update - 28th Jul

28/7/2015

0 Comments

 
LONG TERM TREND                             BEARISH
INTERMEDIATE TERM TREND             BEARISH
SHORT TERM TREND                           BEARISH
VERY SHORT TERM TREND                NEUTRAL
 
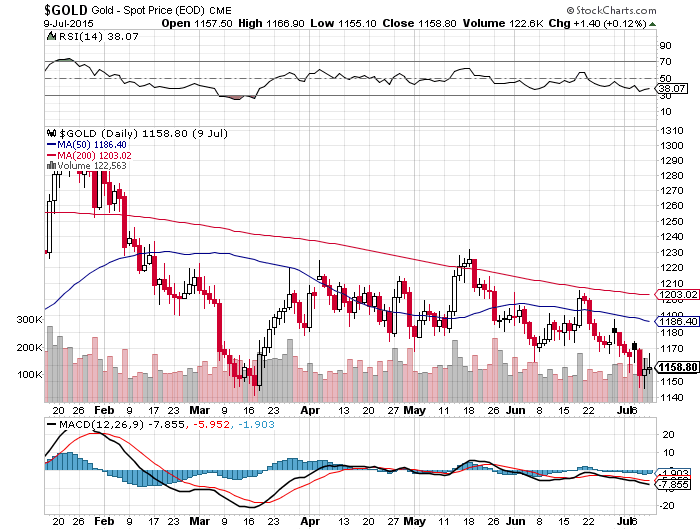
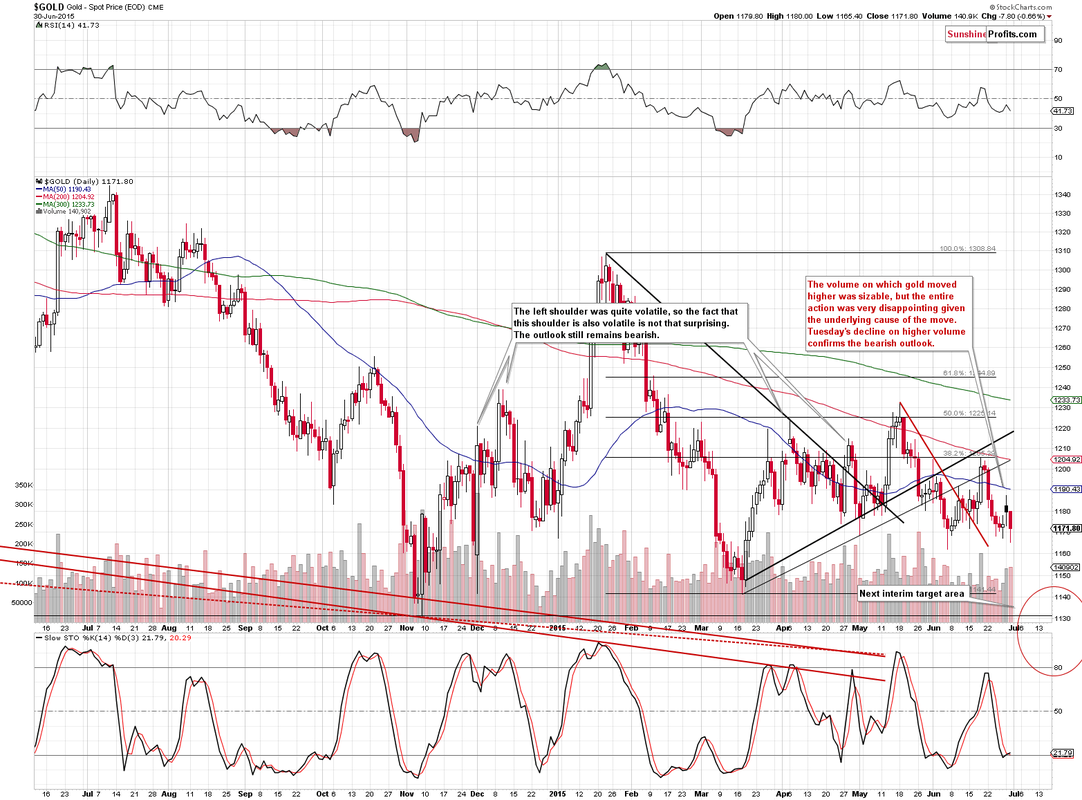
After crashing through the key 1130 level early on Monday morning last week, gold made a lower low at 1074 on Friday before rebounding sharply. The price briefly broke above 1100 and it is clear that gold is attempting to form a local bottom.


We expect a retest of 1130-1140 before the down trend resumes, with our next target 1050, then 1000 below that.  The 20 DMA is currently at 1135 and dropping fast – this will be the first resistance test for the bulls on any rally attempt.  The RSI remains heavily oversold on the daily chart, though the recent bounce has seen the RSI on the shorter timeframes rise well clear of the oversold zone.

Equities remain weak as the uncertainties in Europe and the Chinese stock market weigh on prices, whilst oil continues to tumble with the price now well below $50 a barrel.

Support can be found at 1088, 1080, 1074, 1045, 1000, 950, 867 and 806.  The break of 1130 is very bearish for gold and suggest a return to 1000-1050 in the first instance.

Resistance can be found at 1106, 1110, 1130, 1142, 1147, 1163, 1170, 1175, 1184, 1204, 1208-1210, 1215, 1220-1223, 1235 and 1252-1256.  Gold has broken below the 2014 lows and looks be headed much lower.

Today's video for subscribers looks at the recent trading in more detail and our strategy for today's trading session.


0 Comments

Gold Market Update - 21st Jul

21/7/2015

0 Comments

 
LONG TERM TREND                             BEARISH
INTERMEDIATE TERM TREND              BEARISH
SHORT TERM TREND                           BEARISH
VERY SHORT TERM TREND                 BEARISH
 
After holding the key 1130 level late last week, gold crashed through this major support in the early hours of Monday morning, tumbling as low as 1080 in the thin trading conditions as wave after wave of stops were taken out. 


Gold rebounded quickly though the price has failed to get anywhere near the key 1130 level in the past couple of trading sessions, a level that now becomes strong resistance.  The long term prognosis for gold is now dire, with an initial target of 1050 highly likely to be hit in the coming weeks.

The only chink of light for the bulls is that gold bounced off multi-year support at 1080 - if gold can close the week strongly we will see bullish “hammer” candlestick on the weekly chart, a signal that a rally of some description is likely in gold.  This rally would be seen as a great opportunity to open fresh shorts and is expected to be short-lived, a short, sharp move higher is the most likely scenario.

Equities continue to recover after a sharp sell-off and oil is falling further, trading below $50 a barrel again.

Support can be found at 1080, 1045, 1000, 950, 867 and 806.  The break of 1130 is very bearish for gold and suggest a return to 1000-1050 in the first instance.

Resistance can be found at 1130, 1142, 1147, 1163, 1170, 1175, 1184, 1204, 1208-1210, 1215, 1220-1223, 1252-1256, 1274, 1285, 1297 and 1305-1308.  Gold has broken below the 2014 lows and looks be headed much lower.

Today's video for subscribers looks at the recent trading in more detail and our strategy for today's trading session.


0 Comments

Gold Market Update - 14th Jul

14/7/2015

0 Comments

 
LONG TERM TREND                             BEARISH
INTERMEDIATE TERM TREND              NEUTRAL/BEARISH
SHORT TERM TREND                           BEARISH
VERY SHORT TERM TREND                 BEARISH
 
Gold has steadily sold off over the past week, with the continuing Greek crisis failing to see safe haven demand boost gold’s appeal.  Any short-lived rally is being seen as an opportunity to sell off, with a series of lower highs and lower lows being formed on the daily chart.


Gold is well below all of the major Moving Averages on the daily chart and the 200 hour Moving Average is providing resistance in the short term in a clear down trend.  We expect a test of 1130 in the short term and a failure to hold this level will result in a sharp move down towards 1000-1050 quite quickly.

Equities are recovering after a sharp sell off and oil is tumbling after a strong rally, further pressuring gold – there is currently very little to suggest gold can rally from here.

Support can be found at 1151, 1147, 1142, 1131, 1124, 1100, 1085, 1045, 1000, 950, 867 and 806.  A break of 1130 would be very bearish for gold and suggest a return to 1000-1050 in the first instance.

Resistance can be found at 1163, 1170, 1175, 1184, 1191-1192, 1196-1197, 1204, 1208-1210, 1215, 1220-1223, 1252-1256, 1274, 1285, 1297 and 1305-1308.  After a promising move higher following the break of 1180 last year, gold has failed to break the intermediate down trend and is now heading lower again, closing in on the 2014 lows.

Today's video for subscribers looks at the recent trading in more detail and our strategy for today's trading session.


0 Comments

Seasonal Tendencies for Gold in July 2015

14/7/2015

0 Comments

 
​Free Trading Alert originally published on July 13, 2015, 12:04 PM.
 
“History doesn’t repeat itself but it rhymes” the saying goes. If this is in fact true, and what has happened before might imperfectly repeat itself in the future, this might be used in financial markets. But how to use it exactly? Is there a way to get clear indications as to what used to happen in the past to get a notion of what might come?
 
It is frequently difficult to quantify past events in a meaningful way to get an idea of the possible future tendencies. At Sunshine Profits, we have come up with a methodology to look at the past and recognize tendencies that might repeat themselves in the future – we have developed a tool called True Seasonals to analyze this sort of patterns.
 
Our approach is to look at historical periods: years, quarters and months. We look at those periods and establish how gold, silver and other assets used to behave in these periods. Based on that, we infer what their behavior might be in throughout the year, a given quarter or a given month. The details behind the process are slightly more complicated but the general idea is simple – to look at the past to try to get a sense of what might happen with a given asset.
 
Now this is what we would call seasonality – how gold and other assets behave in different parts of the year. “Sell in May and go away” is yet another saying. It suggests that one should sell gold and silver in May and wait until the fall to reenter the market. Our analysis of seasonal tendencies is actually able to pinpoint whether selling in May actually was, on average, a good idea.
 
Apart from simple seasonal tendencies, there is also on other kind of influence that keeps recurring throughout time. It is the expiration of derivatives. The market is full of rumors how the prices of gold and silver might be kept artificially low around the dates when gold and silver futures and options expire. Whether there is any substance in these claims remains largely questionable. But True Seasonals doesn’t stop at analyzing simple seasonality. It also takes into account the influence derivatives might have on precious metals and other assets. In a way, this is like having two tools in one package.
 
If you haven’t had the chance to do so yet, dive into our report on gold seasonality, which explains True Seasonals in greater detail. In the report, we read:
 
True Seasonals has two basic functions. The first identifies the seasonal influence on stock prices and assesses the risk connected with stocks. This function is able to indicate whether the prices of a stock are usually higher/lower during a particular part of year and whether the risk involved tends to be relatively high or relatively low. Various Internet blogs thrash out this very subject, but this function enables you to confront the buzz with real data.
 
The second function is similar to the first, but instead of identifying the price level and the risk throughout the whole year, it identifies these qualities on the dates of the expiration of derivatives, i.e. gold futures and options, as well as stock options. We designed this function to provide substantial evidence whether or not the expiration of derivatives influences the prices of precious metals. This matter has been the topic of a long-lasting public debate among precious metals investors. This tool puts the debate to rest.
 
We combined these two functions to produce True Seasonals, one of the most comprehensive tools based on seasonal influence and the first one to include the impact of futures and options, making it the best instrument to analyze recurring price changes.
 
So, the general idea is to look at a specific period during a year, say June and True Seasonals will give you the idea on how gold, silver or other assets used to perform, on average, in this period in the past – in this specific example this would be how gold used perform in July in the past. Seeing this performance could help you form an opinion on how gold might perform in July in the future.
 
This will all become a lot clearer once we look at a real example. Let’s consider what True Seasonals would have shown you on May 31, 2015. We’re interested in gold and in a monthly horizon. Additionally, we want to consider the impact of the expiration of futures contracts.
Picture
​We focus on the red line. It is the projected price path for gold for June. As we see, True Seasonals would have suggested on May 31, 2015 that gold would generally depreciate in June. They would have also indicated that there was to be a short-lived rebound in the second part of the month.
 
Now, let’s take a look at a chart showing the actual price for June 2015 (chart courtesy by http://stockcharts.com).
Picture
​If we take a look at the period from the beginning of June (marked as Jun on the chart) to its end (Jul), we see that gold generally declined in June with a sharp and visible bounce in the second half of the month. This bears analogy to what would have been suggested by True Seasonals. The analogy is not perfect but just as we have written earlier “history doesn’t repeat itself, it rhymes.” Meaning that the analogies between past and present events might not be perfect, but they might be useful nonetheless.
 
Now, let’s take a look at what True Seasonals suggest for July.
Picture
​The tool suggests appreciation in the first part of the month but depreciation later on. As it turns out (take a look at the previous chart), there was a move up in the first part of July and it was quickly followed by sharp depreciation. Again, this is not in perfect accordance with the price path suggested by the tool, but it bears resemblance, at least to some extent.
 
One thing to bear in mind is the importance of the Quality of Projection measure. Our report (pdf) on gold seasonality explains:
 
How reliable are True Seasonals? What is the “quality” of the predicted prices? Is it the same no matter what or highly precise at some times and less so at others? Such information could help you decide when it is imperative to use our tool and when it is only optional.
 
Our research team has come up with an answer. Exclusively for this tool and available only at Sunshine Profits, we have designed and implemented a unique measure – Quality of Projection (QoP). You can immediately assess the quality of a predicted price of a particular asset and decide if you want to use True Seasonals in your investment decisions. Moreover, QoP allows you to compare the usefulness of predictions of different stocks and choose the prediction that suits your needs. QoP is based on a 10-point scale where 10 means that on a particular day the prices of a stock used to be very stable and therefore the risk connected with the prediction is relatively low – the quality of the prediction is extremely high and therefore needs to be included in your analysis. To the contrary, 0 and negative values mean that the prices of a stock has been volatile and the quality of prediction is extremely low, investment more risky and the use of True Seasonals only optional.
 
Now, take a look at the chart again. The QoP is relatively high throughout the projection period but it also has a local bottom in the first half of the month, roughly coinciding with the discrepancies between the tool and the actual price path. This stresses the importance of using the QoP measure. Also, note that True Seasonals are to be used in conjunction with other tools. For instance, if there are strong technical signals in the market, they might take precedence over the indications of the tool.
 
If we were to look at the second part of July, True Seasonals suggest depreciation. However, there are also factors other than seasonality at work in the precious metals market. We cover these factors at length in our Gold & Silver Trading Alerts. To get the whole picture, you could combine the analysis from Gold & Silver Trading Alerts with the analysis from True Seasonals.
 
Please, be aware that no representation is being made that the patterns shown by True Seasonals will actually materialize in the future. Mind that the relationships in the precious metals market are not stable and might change over time.
 
If you enjoyed the above discussion of gold seasonality and our analysis, we encourage you to stay up-to-date with our free articles and alerts - sign up for our gold mailing list today. It’s free and if you don’t like it, you can easily unsubscribe.
 
Thank you.
 
Regards,
 
Mike McAra
Sunshine Profits‘ Contributing Author
Gold Investment & Silver Investment at SunshineProfits.com
 
* * * * *
 
 
Disclaimer
 
All essays, research and information found above represent analyses and opinions of Mike McAra and Sunshine Profits' associates only. As such, it may prove wrong and be a subject to change without notice. Opinions and analyses were based on data available to authors of respective essays at the time of writing. Although the information provided above is based on careful research and sources that are believed to be accurate, Mike McAra and his associates do not guarantee the accuracy or thoroughness of the data or information reported. The opinions published above are neither an offer nor a recommendation to purchase or sell any securities. Mr. McAra is not a Registered Securities Advisor. By reading Mike McAra’s reports you fully agree that he will not be held responsible or liable for any decisions you make regarding any information provided in these reports. Investing, trading and speculation in any financial markets may involve high risk of loss. Mike McAra, Sunshine Profits' employees and affiliates as well as members of their families may have a short or long position in any securities, including those mentioned in any of the reports or essays, and may make additional purchases and/or sales of those securities without notice.
0 Comments

Gold Market Update - 8th Jul

8/7/2015

0 Comments

 
LONG TERM TREND                       BEARISH
INTERMEDIATE TERM TREND       NEUTRAL/BEARISH
SHORT TERM TREND                     BEARISH
VERY SHORT TERM TREND          BEARISH
 
Since our last blog update, we saw a sharp rise after the release of the FOMC statement with gold hitting a high just above 1200, however this rally was very short-lived and pounced on as an opportunity to close longs and open new short positions.


Gold has steadily fallen since making this high, despite the escalation of the Greek situation to a full blown crisis, a scenario that should have seen gold rocket higher as a “safe haven” asset – the fact that gold has fallen sharply over the past two weeks even as equities have continued to correct sharply, suggests gold is completely unloved and going much, much lower.

We have been saying for many years that as long as equities remain well supported and continue to attract investment funds, gold will tread water at best.  However, even now where equities are selling off hard and markets are in turmoil gold cannot capitalise – gold bulls are nowhere to be found and we fully expect a test and failure of 1130, with a break below this level making a drop to 1000 highly likely.

Support can be found at 1142-1145, 1131, 1124, 1100, 1085, 1045, 1000, 950, 867 and 806.  A break of 1131 would be very bearish for gold and suggest a return to 1000-1050 in the first instance.

Resistance can be found at 1162, 1170, 1175, 1184, 1191-1192, 1196-1197, 1204, 1208-1210, 1215, 1220-1223, 1252-1256, 1274, 1285, 1297 and 1305-1308.  After a promising move higher following the break of 1180 last year, gold has failed to break the intermediate down trend and is now heading lower again, closing in on the 2014 lows.

Today's video for subscribers looks at the recent trading in more detail and our strategy for today's trading session.


0 Comments

Top 5 Gold Stocks for July 2015

3/7/2015

1 Comment

 
​Free Trading Alert originally published on July 3, 2015, 8:33 AM.
 
In the turbulent times like the ones we might be about to witness, the attention of precious metals investors tends to be focused on metals themselves, in particular gold and silver. Greece seems to be in a pretty precarious position, with a referendum coming in on the acceptance of the terms extended by its creditors. In the whole discussion, gold is being mentioned as the traditional safe-haven asset. The discussion seems to be on whether gold will thrive on a possible Grexit, whether there will be an initial sell-off like back in 2008. In this discussion, the frequently overlooked part of the precious metals market is the array of mining stocks.
 
A couple months back, we wrote a piece on the possible advantages of gold stocks to precious metals investors. If you haven’t had the chance to read this article, we encourage you to do so – particularly the first part, in which we discuss what mining stocks are and what they might offer in terms of investment. One of the most important things about gold stocks is that they might offer leverage over gold, in the sense that they might move more than gold does. Let’s recall our comments from the mentioned article:
 
(…) Miners might offer leverage but not necessarily in the traditional sense of operating on more debt. The leverage here would be possibility to multiply gold’s returns. In simple terms, on average, it is possible that if gold moves 1% up, some miners will move more than 1% up, thereby offering a multiplication effect. In this setting, an investor looking for exposure to the gold market could try to magnify their returns by including selected gold stocks in their portfolio. The catch here is which stocks to choose. Some will have leverage over 1, they will magnify gold’s returns (but also losses), some will have leverage below 1, diminishing returns (but also losses). Moreover, this is not a stable situation. Stocks with most leverage can “lose” it over time and, conversely, stocks with low leverage might “gain” it over time. In other words, if we were to rank gold stocks based on their leverage, they would trade places over time.
 
Since miners might “gain” or “lose” leverage, it might be beneficial to keep track of how the situation evolves, which miners offer the biggest bang for the buck and what order of magnification we are actually writing about. Fortunately, this process can be automated, and we have done so by developing the Gold Stock Ranking. This tool that gathers data, processes it and calculates leverage in an automatic fashion. All you have to do is to click on a list and choose what kind of parameters you’re interested in. The result is a list of miners sorted by how well they track gold and how well they magnify gold’s returns.
 
There is no such thing as the “best” gold stock. It’s more or less like choosing a car – some people need a 4x4, some need a sports car. It depends on personal preferences. In the same way, the choice of gold stocks depends on your personal preferences and circumstances. As we don’t really know them, nothing here should be considered “investment advice” – our tools might help you in investment decisions but you still have to consider various factors and your personal situation.
 
For the purpose of this analysis, we assume that the person interested in gold stocks has low risk tolerance in the sense that they would like their stocks to track gold and would sell gold stocks if they underperformed gold. The other thing to consider is the length of the investment horizon. We will distinguish between holding periods shorter than 6 months and label them a short-term position. A longer time horizon will be considered a long-term position. The main difference here is that short-term positions are more inclined towards speculation and long-term positions are more driven by fundamental factors.
 
We’ll start off with a short-term horizon. Let’s take a look at the Gold Stock Ranking (as at June 30, 2015):
Picture
​First of all, let’s explain the meaning of each column. To do that, we’ll resort to our previous article on top gold stocks:
 
In the first column (“Ranking”) you see the place in the ranking. We limit our discussion to the 5 top stocks in the ranking but the Gold Stock Ranking itself computes all the values for 19 gold stocks of our choice.
 
The second column (“Symbol”) is the symbol (ticker) of a given company you will see on stock exchanges.
 
The third column (“Valuation”) shows you the valuation of the company relative to its “usual” value relative to gold (calculated according to our proprietary methodology). Positive values here mean that the stock might be overvalued relative to gold. By the same token, negative values might suggest that the company is undervalued relative to the yellow metal.
 
The forth column (“Exposure”) shows you how well the company performs as a proxy for gold. It is based on the R-squared (statistical measure) for the gold stock and gold and can be interpreted as how well the price of the gold stock might be explained by the price of gold. 100% is the maximum value here, 0% the minimum. Generally, values over 50% might be considered as relatively significant.
 
The fifth column (“Leverage”) should be familiar by now – this is the leverage relative to gold, as explained earlier in this article. In general, the higher the value in this column, the greater the leverage – the more the moves of the price of the gold stock have magnified the moves of the price of gold. A value above 1 means that the stock has, on average, outperformed gold, a value below 1 means that the stock has, on average, underperformed the yellow metal. A negative value shows that the stock has, on average, traded in the opposite direction than gold.
 
The above picture is only a snapshot of what you can see using our gold stock tool. The version you can use on our site is interactive, meaning that you can choose the parameters of your choice and you can hover the mouse cursor over various parts of the tool to get info on what each part shows you. So, you can use this article as a guide to how you can use the tool and then head over to our website and test it for yourself.
 
Now, let’s get down to the nitty-gritty and check what stocks ranked highest at the beginning of July 2015.
 
Randgold Resources (GOLD) takes the first place with exposure at over 90% and leverage above 1.5. To break this down, Randgold seems to move in the same direction as the price of gold (exposure) and magnifies gold’s gains (and losses; leverage), on average and based on past data. The Gold Stock Ranking sums this up: “Including GOLD [ticker for Randgold Resources] in your portfolio appears to be a good idea.” Rangold might be slightly overvalued according to our methodology, just over 3%, but the valuation doesn’t seem to be too big a concern – this is not an extreme position.
 
Royal Gold (RGLD) comes in second, with exposure over 80% and leverage slightly over 1. These results are less favorable than for Rangold, both in terms of exposure and leverage, but by no means very bad ones. The Gold Stock Ranking gives you a hint that “Purchasing RGLD might be useful for diversification purposes, but it seems that it’s not providing much advantage over investing in gold itself.” Royal Gold is not exactly a terrible gold stock by our criteria but not a terrific one either. One concern here is that Royal Gold seems to be overvalued relative to gold by over 25%. The tool also gives you info that you might consider switching to other stocks close in the ranking but less overvalued (or even undervalued) around price bottoms. Rangold, holding the first spot, seems like a better choice during such times.
 
Eldorado Gold (EGO) holds the third spot but with visibly worse exposure to gold than the two previous stocks. Exposure is still above 50% and leverage above 1 (and better than for Royal Gold), and the Gold Stock Ranking boils this down to the message that “Purchasing EGO might be useful for diversification purposes, but it seems that it’s not providing much advantage over investing in gold itself.” As Royal Gold before, Eldorado doesn’t seem to be unfavorable as such but it doesn’t quite shine. One positive thing about Eldorado is that it seems undervalued relative to gold. Also, its valuation seems to be quite an advantage over Royal Gold. In this sense, one might consider switching from Royal Gold to Eldorado around price bottoms.
 
The exposure and leverage values deteriorate for the remaining two stocks, and this might be a suggestion that they neither track gold relatively well, nor offer leverage. In fact, the Gold Stock Ranking suggests: “Purchasing [them] is not advised.”
 
The analysis of the short-term time horizon has allowed us to identify one stock with possibly favorable characteristics (Rangold) and two with less favorable but still worth considering for diversification purposes (Royal Gold and Eldorado).
 
We have considered short-term positions. Now let’s take a look at what the long-term picture suggests (as at June 30, 2015):
Picture
​AngloGold Ashanti (AU) lands first, with exposure slightly under 75% and leverage above 5. The exposure itself is decent but it is the leverage where the stock seems to shine – the leverage value is visibly higher than was the case for any of the short-term positions. The tool suggests: “Including AU in your portfolio appears to be a very good idea.” Valuation doesn’t seem to be a concern – AngloGold is marginally overvalued relative to gold. Considering all the points made above, AngloGold seems to be favorable or at least neutral as far as all the metrics are concerned.
 
The second place is taken by Harmony Gold Mining Company (HMY). Harmony Gold has similar characteristics to AngloGold Ashanti here, with marginally lower exposure over 70% and slightly lower leverage under 5 but it might also be slightly undervalued instead of slightly overvalued. The Gold Stock Ranking suggests: “Including AU in your portfolio appears to be a very good idea.” Both AngloGold and Harmony Gold seem to be favorable. The difference between the valuations of the two doesn’t seem significant enough to consider switching between them at the bottoms.
 
Barrick Gold (ABX) comes in third with lower exposure and leverage values than the two previous stocks, but still relatively favorable. Our ranking suggests: “Including ABX in your portfolio appears to be a good idea.” Barrick Gold also offers a slightly more favorable valuation – it seems to be over 4% undervalued relative to gold. Barrick Gold might be the stock to look at when considering further diversification of one’s mining stock holdings.
 
Yamana Gold (AUY) is fourth and it seems interesting since it has relatively weak exposure,  definitely lower than the previous choices but at the same time it has the highest leverage of all the stocks in the long-term ranking (not only of the five presented; leverage under 6) and it is undervalued, slightly more than 6% undervalued. The tool suggests: "Including AUY in your portfolio appears to be a good idea.”
 
The last place in our analysis is taken by Newcrest Mining (NCMGY), which has more favorable exposure to gold than Yamana Gold, but less favorable leverage (over 3). It is slightly undervalued and the tools still suggests: “Including NCMGY in your portfolio appears to be a good idea.”
 
Taking a look at both the short- and long-term tables, we reach a relatively surprising conclusion, compared with our previous results on gold stocks. The exposure to gold is more favorable for only two first stocks in the short-term table, but it drops off quickly to relatively unfavorable values. With a drop in exposure follows a visible shift downward in leverage. The exposure in the long-term is more consistent, dropping from as we go down in the table, but not as much as for the short-term positions. The leverage seems a lot more favorable for the long-term positions than for the short-term ones. The only parts where short-term positions seem to offer an advantage is the exposure for the top two stocks and the possible undervaluation but the undervaluation coincides with dropping exposure.
 
There seems to be a shift from the situation at the beginning of 2015. The tradeoff between more exposure for short-term positions and more leverage for long-term positions is less obvious that it was back then. Right now, there seem to be stocks that offer relatively much exposure, upward of 70% and favorable leverage levels on the order of 5. No stock in the long-term ranking is discouraged as an investment. As such, long-term positions might offer favorable characteristics if one is looking for leverage as defined in this article.
 
Please, be aware that no representation is being made that the particular gold stocks will enjoy the same levels of leverage and exposure to gold in the future. Mind that the relationship between leverage and exposure is not stable and might change over time.
 
In this article, we have discussed the top 5 gold stock picks according to the Gold Stock Ranking, our interactive tool. To get to know this tool, head over to our gold stock ranking page. You can adjust the parameters of the tool to your liking there. If your interest in miners extends to silver stocks, check out our Silver Stock Ranking.
 
As has been already mentioned, the relationships shown in the Gold Stock Ranking change over time. It’s best to monitor one’s portfolio and review the appropriateness of the positions. We can’t stress the importance of proper portfolio structuring and invite you to read our piece on gold and silver portfolio construction, to get to know our take on various parts of the precious metals portfolio.
 
If you enjoyed the above discussion of mining stocks and our analysis, we encourage you to stay up-to-date with our free articles and alerts - sign up for our gold mailing list today. It’s free and if you don’t like it, you can easily unsubscribe.
 
Thank you.
 
Regards,
 
Mike McAra
Sunshine Profits‘ Contributing Author
Gold Investment & Silver Investment at SunshineProfits.com
 
* * * * *
 
 
Disclaimer
 
All essays, research and information found above represent analyses and opinions of Mike McAra and Sunshine Profits' associates only. As such, it may prove wrong and be a subject to change without notice. Opinions and analyses were based on data available to authors of respective essays at the time of writing. Although the information provided above is based on careful research and sources that are believed to be accurate, Mike McAra and his associates do not guarantee the accuracy or thoroughness of the data or information reported. The opinions published above are neither an offer nor a recommendation to purchase or sell any securities. Mr. McAra is not a Registered Securities Advisor. By reading Mike McAra’s reports you fully agree that he will not be held responsible or liable for any decisions you make regarding any information provided in these reports. Investing, trading and speculation in any financial markets may involve high risk of loss. Mike McAra, Sunshine Profits' employees and affiliates as well as members of their families may have a short or long position in any securities, including those mentioned in any of the reports or essays, and may make additional purchases and/or sales of those securities without notice.
1 Comment

Gold & Silver Trading Alert: Gold Stocks Break Below 2008 Low

1/7/2015

0 Comments

 
​Gold Trading Alert originally published on July 1st, 2015 8:23 AM:
 
Briefly: In our opinion, short (half) speculative positions in gold, silver and mining stocks are justified from the risk/reward point of view.
 
Gold and silver declined yesterday, but the really profound action was seen in the precious metals mining stocks. Both key indices for this sector (the HUI and XAU) declined below their respective 2008 lows and managed to close below them. What’s next? Will gold and silver stocks bounce like they did in late 2014?
 
Before moving to the situation in the XAU and HUI, let’s take a look at the metals, starting with gold (charts courtesy of http://stockcharts.com). 
Picture
​In yesterday’s alert, we commented in the following way on gold’s Monday’s rally:
 
Gold moved higher yesterday and… That’s about it when it comes to listing yesterday’s bullish signs. The size of the move compared with its likely cause (closed banks in Greece and the introduction of capital controls), however, is actually bearish. Gold didn’t react in a meaningful way to a very bullish factor, and this is a strong sign that the gold market lacks buying power and that it will move lower sooner rather than later.
 
We didn’t have to wait for more weakness long – gold declined on Tuesday and it practically erased Monday’s gains. The volume on which gold declined was slightly higher than the one on which it had rallied on, which also supports the bearish outlook.
 
Please note that there were only a few cases in the previous months when gold closed below $1,170. When that happened, it moved to $1,140 quite quickly. Consequently, we will not be surprised to see gold trading in tune with this pattern once again in the coming days.
Picture
​The situation in the silver market didn’t change – it’s been bearish and it still is. Yesterday’s decline is another step toward our target areas.
 
While we haven’t seen anything new in the silver market, we saw a major development in mining stocks. Both the XAU and HUI indices moved below their respective 2008 lows and while the breakdowns were not confirmed, they already made the picture more bearish.
Picture
​In yesterday’s alert we wrote the following:
 
Gold stocks held up relatively well last week by not moving below their 2008 low. Not only was it natural, but it also seems that the miners’ “strength” was just temporary. Gold stocks declined despite rising gold once again yesterday and the implications are bearish. The support created by the 2008 low was not broken so the situation did not become extremely bearish for the short term, but still, it deteriorated.
 
Once this support is broken, the following decline could be sharp, so it seems justified to have at least a small speculative short position in this market at this time.
 
We have seen the mentioned breakdown (the HUI closing below 150), but before we say that they situation has become extremely bearish, we would prefer to see 2 additional daily closes below the 2008 low. In other words, we would like to see the breakdown confirmed. 
Picture
​We see exactly the same signal on the above chart. The XAU index closed below its 2008 low, but before this has very meaningful implications we will need to see the confirmation of the breakdown.
 
The fact that both indices are moving below their 2008 lows somewhat confirms this move, but in our opinion it’s not enough to make the breakdowns really confirmed.
 
The most important thing about the mentioned breakdowns is that it all happened when the precious metals sector should have moved higher based on the crisis in Greece. The precious metals market is not only not rallying despite positive news – mining stocks (which should be outperforming gold if we were to see a rally) even managed to decline and break below a critical support. The implications are clearly bearish.
 
Before summarizing, we would like to reply to the question that we received from one of our subscribers as it seems that our reply could be useful for you as well:
 
Hello, I am a long time subscriber to your Alerts. I have a question to  ask the editor about gold.  The Yuan is almost certain to become a reserve currency as early as  September. China is also waiting for Central approval to set up a gold  fix and finally it has been speculated that the Chinese government will  be announcing their gold reserve, in a way backing their currency with  gold. How would these affect the price of gold and the US$? Would we  have time to react? Thank you.
 
Thank you for your message. IF (!) China moves to the gold standard, the demand for the yuan will likely rise greatly, which would also mean increased demand for gold and thus its appreciation in non-yuan terms (also in terms of the USD).
 
IF - because we don't view this as likely. A significant appreciation of the yuan would severely hurt Chinese exports, which are very important for the Chinese economy. On a side note, if many gold investors view the above as likely and the price still disappoints (and miners continue to decline) then this is another sign that we will see much lower prices before seeing a major rally.
 
If that was to happen anyway... Would we have time to react?
 
In a way, we already reacting - we have part of our capital (the insurance part of the gold portfolio) in gold and silver, which makes sure that we won't miss a major rally in case of a sudden shock in the market.
 
As far as the rest of the capital is concerned, in short, yes, if by having time to react one means getting in the market well ahead of the vast majority of investors. We would probably have as much time to react as we had when gold broke below critical support levels in April 2013.
 
On April 12 we sent / posted the alert at 11:22 AM (gold was at about $1,500) in which we suggested closing the remaining half of the long-term investments in mining stocks (we exited the first half on April 4) and closing / hedging half of the long-term investments in gold and silver. We wrote about exiting the remaining half position in gold and silver in the April 15 (6:33 AM) alert. At that time gold was at about $1,410-$1,415.
 
Our aim was to exit the long-term positions completely after a meaningful breakdown below the 2012 lows. On Apr 12, we wanted to take action tens of dollars above $1,500, but the move was very volatile and even though we wanted to distribute the information earlier, we couldn't do it as the message had to be written, checked and sent (including quick proofreading and sending a test e-mail message to make sure that it went through). There are some limits to the form of providing signals in a newsletter that we aim to minimize, but we are not able to completely erase in this form of providing our services.
 
There might be a way for us to react much sooner and for you to "take action" almost instantly, but we can't publicly discuss the details (at least not yet).
 
Summing up, the situation in the precious metals market remains bearish and based on this week’s disappointing performance of precious metals and very weak performance of mining stocks (and the breakdown below the critical support), it further deteriorated. It’s not extremely bearish just yet as we haven’t seen a confirmed breakdown in the HUI and XAU indices below their 2008 lows, so we don’t think that doubling the size of our profitable short position is justified just yet. We’re very close to this moment, though. It will take only 2 additional daily closes below the 2008 lows for the breakdowns to be confirmed and for the situation to become extremely bearish. On the other hand, we could see a reversal here or other signs of strength that could make us take profits off the table and enter long positions. It doesn’t seem likely at this time, but we are not ruling out such a scenario.
 
To summarize:
 
Trading capital (our opinion): Short position (half) position in gold, silver and mining stocks is justified from the risk/reward perspective with the following stop-loss orders and initial (!) target prices:
 
Gold: initial target price: $1,115; stop-loss: $1,253, initial target price for the DGLD ETN: $87.00; stop loss for the DGLD ETN $63.78
 
Silver: initial target price: $15.10; stop-loss: $17.33, initial target price for the DSLV ETN: $67.81; stop loss for DSLV ETN $41.17
 
Mining stocks (price levels for the GDX ETN): initial target price: $16.63; stop-loss: $21.83, initial target price for the DUST ETN: $23.59; stop loss for the DUST ETN $10.37
 
In case one wants to bet on lower junior mining stocks' prices (we do not suggest doing so – we think senior mining stocks are more predictable in case of short-term trades – we if one wants to do it anyway, we provide the details), here are the stop-loss details and initial target prices:
 
GDXJ: initial target price: $21.17; stop-loss: $28.68
JDST: initial target price: $14.35; stop-loss: $5.65
 
 
Long-term capital (our opinion): No positions
 
Insurance capital (our opinion): Full position
 
You will find details on our thoughts on gold portfolio structuring in the Key Insights section on our website.
 
Thank you.
 
Przemyslaw Radomski, CFA
Founder, Editor-in-chief
Gold Investment & Silver Investment at SunshineProfits.com
 
 
* * * * *
 
 
Disclaimer
 
All essays, research and information found above represent analyses and opinions of Przemyslaw Radomski, CFA and Sunshine Profits' associates only. As such, it may prove wrong and be a subject to change without notice. Opinions and analyses were based on data available to authors of respective essays at the time of writing. Although the information provided above is based on careful research and sources that are believed to be accurate, Przemyslaw Radomski, CFA and his associates do not guarantee the accuracy or thoroughness of the data or information reported. The opinions published above are neither an offer nor a recommendation to purchase or sell any securities. Mr. Radomski is not a Registered Securities Advisor. By reading Przemyslaw Radomski's, CFA reports you fully agree that he will not be held responsible or liable for any decisions you make regarding any information provided in these reports. Investing, trading and speculation in any financial markets may involve high risk of loss. Przemyslaw Radomski, CFA, Sunshine Profits' employees and affiliates as well as members of their families may have a short or long position in any securities, including those mentioned in any of the reports or essays, and may make additional purchases and/or sales of those securities without notice.
0 Comments

    Old Posts

    August 2021
    July 2021
    June 2021
    May 2021
    March 2021
    February 2021
    January 2021
    December 2020
    November 2020
    March 2019
    January 2019
    December 2018
    October 2018
    September 2018
    August 2018
    July 2018
    June 2018
    May 2018
    March 2018
    February 2018
    July 2017
    June 2017
    May 2017
    April 2017
    March 2017
    February 2017
    January 2017
    December 2016
    July 2016
    March 2016
    December 2015
    November 2015
    October 2015
    September 2015
    August 2015
    July 2015
    June 2015
    May 2015
    April 2015
    March 2015
    February 2015
    January 2015
    December 2014
    November 2014
    October 2014
    September 2014
    August 2014
    July 2014
    June 2014
    May 2014
    April 2014
    March 2014
    February 2014
    January 2014
    December 2013
    November 2013
    October 2013
    September 2013
    August 2013
    July 2013
    June 2013
    May 2013
    April 2013
    March 2013
    February 2013
    January 2013
    December 2012
    November 2012
    October 2012
    September 2012
    August 2012
    July 2012
    June 2012
    May 2012
    April 2012
    March 2012
    February 2012
    January 2012
    December 2011
    November 2011
    October 2011

UK Gold Trading Experts (UKGTE) is a trading name of Drupac Limited, a company registered in England and Wales (company number 09167819) whose registered office is 1 St. Paul's Square, Birmingham, B3 1QU.