UK Gold Trading Experts
  • Home
  • Trade Like a Pro
  • Gold Blog
  • Subscriber Resources
  • Legal Stuff
    • User Agreement
  • Contact Us

Gold Market Update - 31st Oct

31/10/2014

0 Comments

 
LONG TERM TREND:                  BEARISH
INTERMEDIATE TERM TREND:     BEARISH
SHORT TERM TREND:                BEARISH
VERY SHORT TERM TREND:        BEARISH

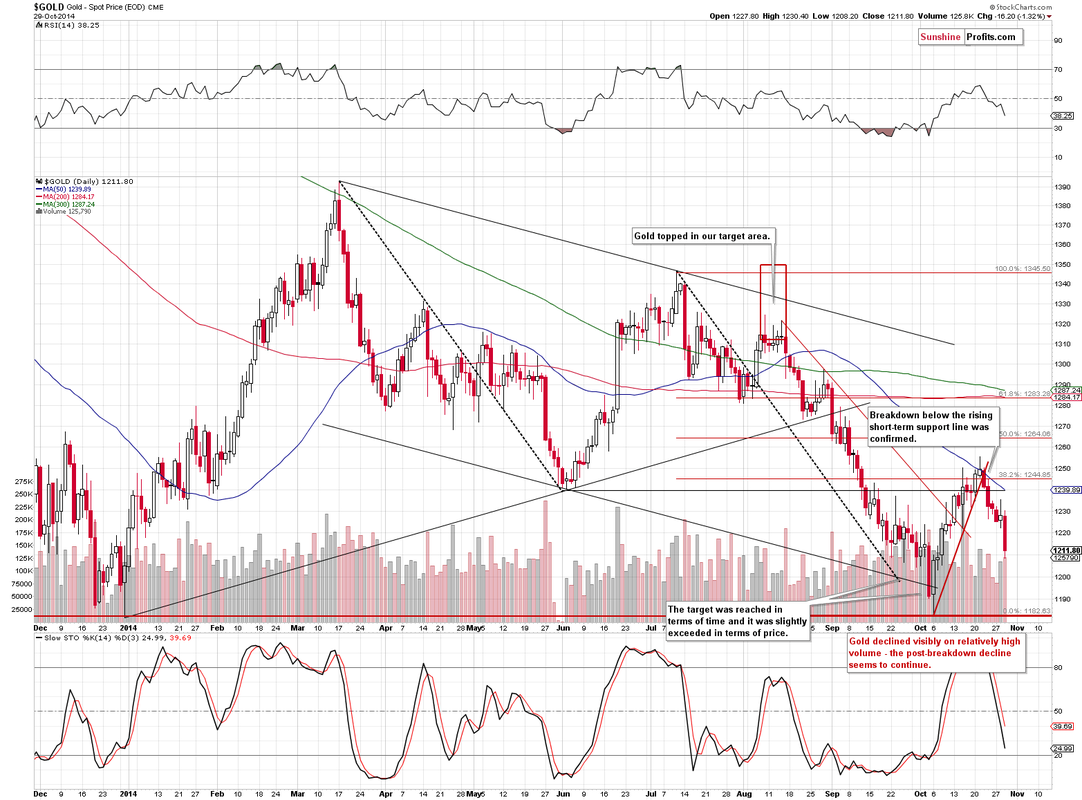
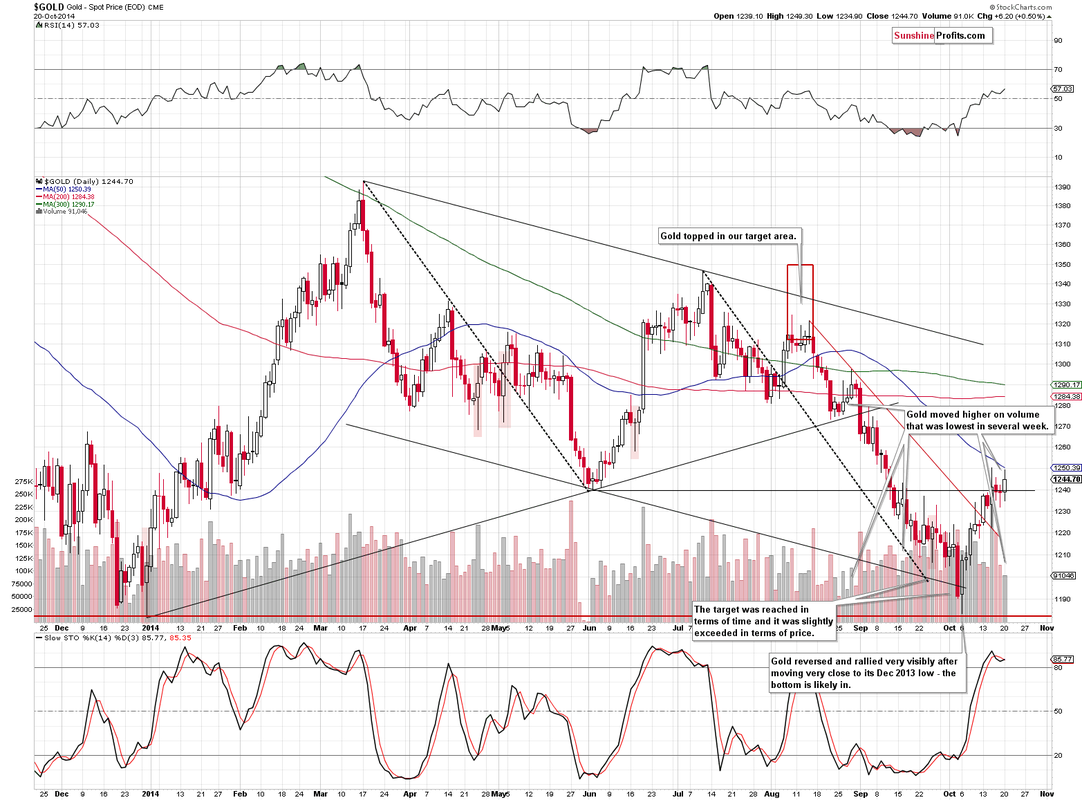
Gold has been crushed overnight, breaking 1200 and rapidly capitulating through the critical 1180 level, falling as low as 1167 before finding some support.  The market is currently consolidating just above these lows at 1175, with further declines almost inevitable.

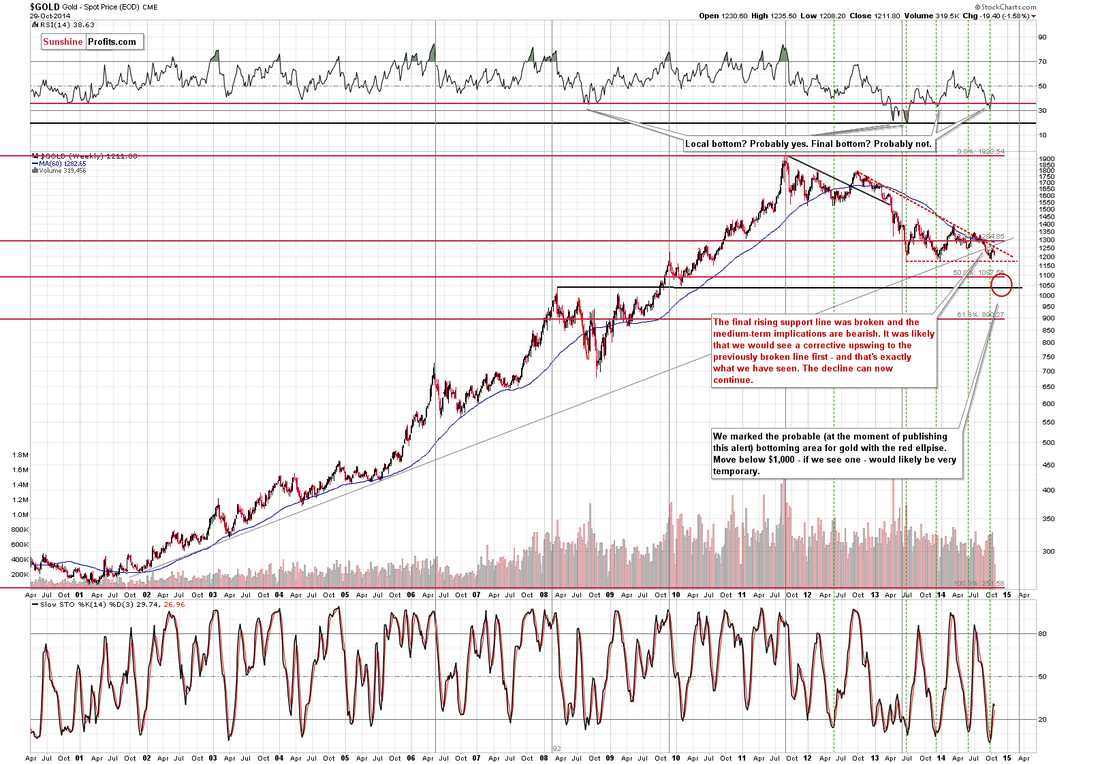
A close below 1180 will confirm the return of the intermediate bear market and suggest a return to 1000-1050 in the short term, with even lower prices possible next year.

We have been calling for this scenario for months and our subscribers are already well placed in the market to take advantage of what is likely to be the trade of the year.

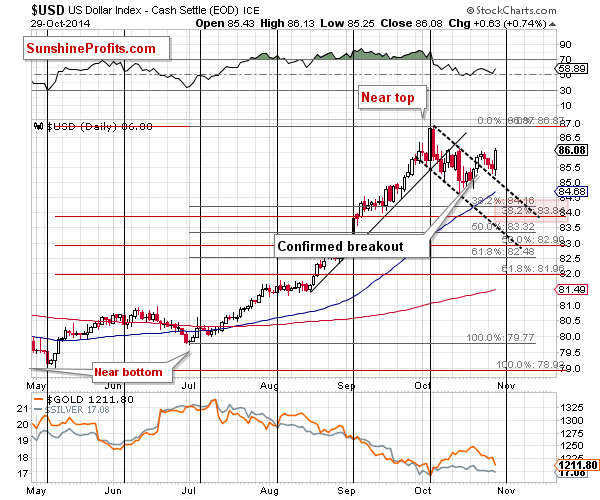
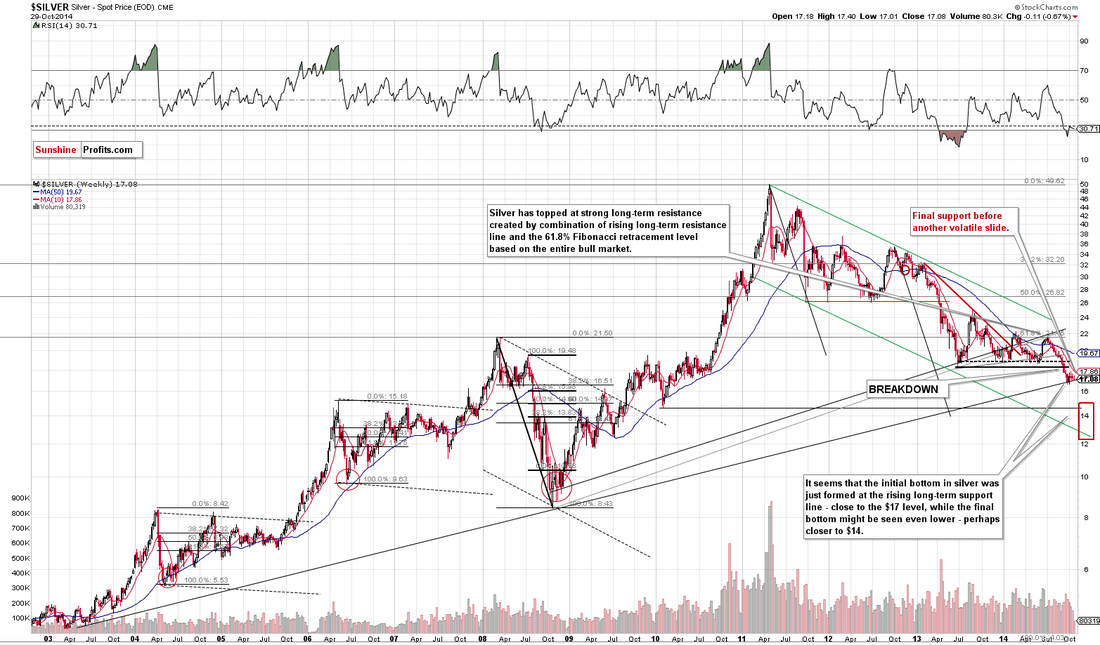
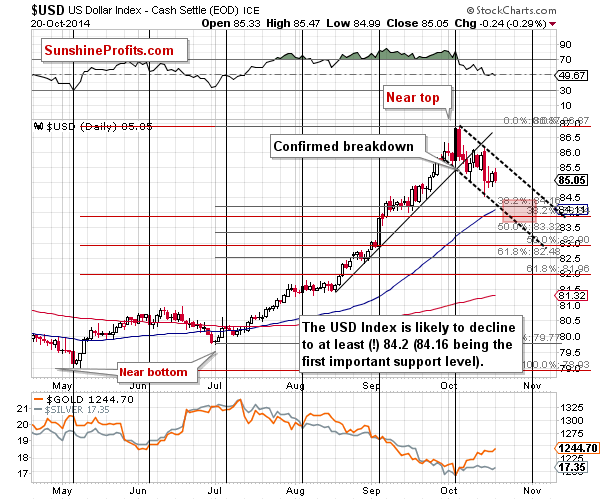
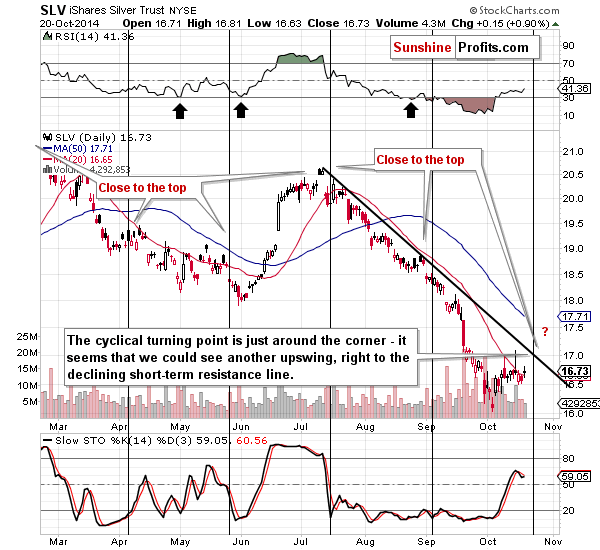
Silver is leading the precious metals lower and has been signalling this move for weeks, with oil tumbling towards $80, equities surging towards all time highs and the dollar rampant again.

Support can be found at 1167, 1158-1161, 1145, 1124, 1100, 1085, 1045 and 1000 . The break of 1180 has serious bearish implications for gold and suggests a decline to 1000-1050 in the short term.

Resistance can be found at 1180, 1200, 1217, 1225, 1232, 1235, 1250, 1255, 1263, 1271-1273, 1290-1292, 1300-1302, 1310-1312, 1322-1325, 1333-1335 and 1345.  A second failure to break through the key 65 week MA confirms that the intermediate down trend is intact and the break of 1180 suggests the bears are in full control.

Today's video for subscribers looks at the recent trading in more detail and our strategy for our current trading positions.
0 Comments

Gold Market Update - 30th Oct

30/10/2014

0 Comments

 
LONG TERM TREND:                   BEARISH
INTERMEDIATE TERM TREND:     NEUTRAL/BEARISH
SHORT TERM TREND:                BEARISH
VERY SHORT TERM TREND:        BEARISH

Gold tumbled late yesterday after what was perceived to be a hawkish FOMC statement, suggesting that the strength of the US economy will result in interest rate hikes next year.  This upbeat economic assessment took markets by surpise and seems at odds with the recent financial data from the US that has been less than impressive.

The dollar surged higher and this morning, gold has continued to fall and is trading just above 1200, whilst the dollar is trading well above 86.

There is now very little support before the major 1180 level in gold, the bears will feel they have the momentum to finally smash through tihs key level and take gold all the way down to 1000 in the resulting sell off.

Support can be found at 1203-1205, 1200 and 1180-1183. A break of 1180 would have serious bearish implications for gold and suggest a decline to 1000-1050 in the short term - the failure to break the 65 week MA and the break down of the triangle pattern on the daily chart makes this scenario much more likely, particularly as gold has now reached and tested this crucial support level.

Resistance can be found at 1217, 1225, 1232, 1235, 1250, 1255, 1263, 1271-1273, 1290-1292, 1300-1302, 1310-1312, 1322-1325, 1333-1335 and 1345.  A second failure to break through the key 65 week MA confirms that the intermediate down trend is intact and a retest of 1180 suggests a break of that level is likely.

Today's video for subscribers looks at the recent trading in more detail and our strategy for our next trade.
0 Comments

Gold & Silver Trading Alert: Gold Declines Once Again As Expected

30/10/2014

0 Comments

 
Gold & Silver Trading Alert originally published on October 30th, 2014 7:01 AM:

Briefly: In our opinion speculative short positions (full) in gold, silver and mining stocks are justified from the risk/reward perspective.

Gold and mining stocks declined yesterday in a rather profound way. The GDX ETF finally broke below its 2013 lows and the volume that corresponded to this action was high. However, silver almost didn’t react – why didn’t it? Will we see a rally shortly?

In short, not likely. There was a good reason for silver to hold up strongly at this time. However, before we move to this situation, let’s take a look at the “background info” – the changes in the USD Index (charts courtesy of http://stockcharts.com).

Picture
In yesterday’s alert we wrote the following:

The breakout above the declining resistance line is now confirmed by more than 3 consecutive closes above the resistance line, so it is definitely meaningful. As always, this does not guarantee a move higher, but it made it much more probable. In fact, a move higher in the very short term is now more probable than a move lower. It now seems likely that the USD Index will move higher at least until the next cyclical turning point – meaning for another week or so.

Actually, the USD Index moved slightly lower yesterday and on Monday, but the breakout was not invalidated, so the move didn’t change anything in the outlook for the index.

The implications for gold and the rest of the precious metals sector are bearish.

It turns out that the USD Index rallied and gold declined – after a confirmed breakout and breakdown, respectively. The situation developed as we had expected it to. What’s next? The cyclical turning point is at hand, so we might not see many more daily upswings in the near future. The closest resistance is at the previous October high, about an index point above Wednesday’s close. Consequently, we are quite likely to see another sharp upswing, but it also seems likely that the USD Index will at least pause after reaching its previous high, at or close to the turning point.

Picture
From the long-term perspective we see that this month’s rally was in fact a corrective upswing that took gold to combination of strong resistance lines. It was a breather that we expected to see and as it’s already been seen, so we can now expect the decline to continue. Perhaps the next big slide is already underway.

Picture
The short-term gold chart shows that the decline is indeed underway. That’s another expected development. Gold confirmed the breakdown below the short-term rising support line just a few days ago and based on this action, i.a., we decided to open short positions and they are already profitable. The decline that accompanied yesterday’s decline was significant, which serves as a bearish confirmation.

Please note that the RSI indicator is not oversold, so gold can very well fall further. How low can gold go initially? At least to the previous October low, but we think that the final bottom will be much lower.

Earlier today we mentioned silver by saying that it was no wonder that it hadn’t declined much yesterday. The reason is the proximity of the rising long-term support line.

Picture
Silver remains “strong” as it’s right at this line. We don’t think this is a real sign of strength of the white metal. When silver finally gives in and breaks this level, it’s likely to catch up with gold and miners and decline sharply. Please note that once this support is taken out there will be no other support to stop the decline until the white metal moves below $15.

Is silver still a great investment when one takes a few years into account? We think so.

Can silver plunge very low before it starts another powerful rally regardless of its favorable fundamental situation? Yes, it can.

Picture
As mentioned previously, the GDX ETF moved to new lows and it happened on huge volume. That was a very bearish development, especially that the HUI and XAU indices had already broken below their respective lows.

Summing up, the situation in the precious metals market was bearish but based on yesterday’s price action it has now become even more bearish (taking the short term into account). While we wrote that it was justified to open small short positions in the sector a few days ago (which are already profitable), it seems that doubling them at this time is also justified (as always, just our opinion).

Still, please note that it is generally not a good idea to use all or most of ones capital for a given trade. One should not trade more than they can afford to lose. We are after several months of winning trades (taking all sectors into account at the same time) in a row, so it might seem that the next trade can’t go wrong. It could, as there are no sure bets in any market  - so caution is still suggested.  

We will continue to monitor the situation and provide our insights in our daily (or intraday if the situation requires it) Gold & Silver Trading Alerts.  

To summarize:  

Trading capital (our opinion):

It seems that having speculative (full) short positions in gold, silver and mining stocks is a good idea:  

  • Gold: stop-loss: $1,268, initial target price: $1,192 stop loss for the DGLD ETF $65.35, initial target price for the DGLD ETF $78.65

  • Silver: stop-loss: $17.87, initial target price: $15.11 stop loss for DSLV ETF $57.69, initial target price for the DSLV ETF $89.22

  • Mining stocks (price levels for the GDX ETF): stop-loss: $22.33, initial target price: $17.11, stop loss for the DUST ETF $21.33, initial target price for the DUST ETF $43.77


    In case one wants to bet on lower junior mining stocks' prices, here are the stop-loss details and initial target prices:


  • GDXJ: stop-loss: $36.23, initial target price: $25.13

  • JDST: stop-loss: $9.54, initial target price: $30.56


    Long-term capital (our opinion): No positions


    Insurance capital (our opinion): Full position


    You will find details on our thoughts on gold portfolio structuring in the Key Insights section on our website.


As always, we'll keep our subscribers updated should our views on the market change. We will continue to send them our Gold & Silver Trading Alerts on each trading day and we will send additional ones whenever appropriate. If you'd like to receive them, please subscribe today.

We were bullish on gold as far medium-term is concerned for the vast majority of the time until April 2013. After that we have generally been expecting lower prices. Are we gold bears? No - we view this decline as lengthy, but temporary. We expect gold to rally in the coming years, but instead of following the buy-and-hold approach, we exit the long-term precious investments at the most unfavorable times and re-enter when things look good again, thus saving a lot of money. Additionally, our Gold & Silver Trading Alerts help you profit from the short-term price swings. We invite you to examine our premium services and encourage you to sign up for our free mailing list today.


Thank you.


Przemyslaw Radomski, CFA

Founder, Editor-in-chief

Tools for Effective Gold & Silver Investments - SunshineProfits.com

Tools für Effektives Gold- und Silber-Investment - SunshineProfits.DE


* * * * *


Disclaimer


All essays, research and information found above represent analyses and opinions of Przemyslaw Radomski, CFA and Sunshine Profits' associates only. As such, it may prove wrong and be a subject to change without notice. Opinions and analyses were based on data available to authors of respective essays at the time of writing. Although the information provided above is based on careful research and sources that are believed to be accurate, Przemyslaw Radomski, CFA and his associates do not guarantee the accuracy or thoroughness of the data or information reported. The opinions published above are neither an offer nor a recommendation to purchase or sell any securities. Mr. Radomski is not a Registered Securities Advisor. By reading Przemyslaw Radomski's, CFA reports you fully agree that he will not be held responsible or liable for any decisions you make regarding any information provided in these reports. Investing, trading and speculation in any financial markets may involve high risk of loss. Przemyslaw Radomski, CFA, Sunshine Profits' employees and affiliates as well as members of their families may have a short or long position in any securities, including those mentioned in any of the reports or essays, and may make additional purchases and/or sales of those securities without notice.


0 Comments

Gold Market Update - 28th Oct

28/10/2014

0 Comments

 
LONG TERM TREND:                   BEARISH
INTERMEDIATE TERM TREND:     NEUTRAL/BEARISH
SHORT TERM TREND:                 NEUTRAL/BEARISH
VERY SHORT TERM TREND:       NEUTRAL

After touching the long term down trend channel at 1255 last week, gold sold off sharply on Thursday and has spent the last few trading sessions consolidating near the lows at 1230 in quiet market conditions.

The test and rejection of the resistance level at 1255 will have bulls on alert for further declines, with a return to 1180 still the favoured scenario within the next 30 days.  The market also failed to break the 50 DMA and is currently testing the 20 DMA around 1230.

Equities and the dollar appear to have finished their respective corrections and are looking in bullish mode again - this is clearly bearish for gold.  Oil continues to tumble, with the price struggling to hold onto support around $80 a barrel - this is also bearish for gold and suggests inflation is not an issue in fact deflation is rearing its head once more.

Support can be found at 1222, 1217, 1203-1205, 1200 and 1180-1183. A break of 1180 would have serious bearish implications for gold and suggest a decline to 1000-1050 in the short term - the failure to break the 65 week MA and the break down of the triangle pattern on the daily chart makes this scenario much more likely, particularly as gold has now reached and tested this crucial support level.

Resistance can be found at 1232, 1238, 1250, 1255, 1263, 1271-1273, 1277, 1290-1292, 1300-1302, 1310-1312, 1322-1325, 1333-1335, 1340-1342, 1352-1354 and 1392-1395. A second failure to break through the key 65 week MA confirms that the intermediate down trend is intact and a retest of 1180 suggests a break of that level is likely.

Today's video for subscribers looks at the recent trading in more detail and our strategy for our next trade.
0 Comments

Gold Market Update - 22nd Oct

22/10/2014

0 Comments

 
LONG TERM TREND:                   BEARISH
INTERMEDIATE TERM TREND:     NEUTRAL/BEARISH
SHORT TERM TREND:                 NEUTRAL/BULLISH
VERY SHORT TERM TREND:       BULLISH

Gold made a new high yesterday of 1255 before retreating back below 1250, forming a "shooting star" candlestick on the daily chart.  This suggests that a top is forming here, just below our target of 1265.

This morning, gold is off a few dollars at 1247 with equities well off their recent lows and oil above $82.  The dollar is also seeing some buying strength this morning and is also well off recent lows.

We maintain our stance that the recent rally in gold is corrective in nature and after an ABC counter trend rally, we expect the decline to resume.

Support can be found at 1246, 1235-1238, 1232, 1222, 1217, 1203-1205, 1200 and 1180-1183. A break of 1180 would have serious bearish implications for gold and suggest a decline to 1000-1050 in the short term - the failure to break the 65 week MA and the break down of the triangle pattern on the daily chart makes this scenario much more likely, particularly as gold has now reached and tested this crucial support level.

Resistance can be found at 1250, 1255, 1263, 1271-1273, 1277, 1290-1292, 1300-1302, 1310-1312, 1322-1325, 1333-1335, 1340-1342, 1352-1354 and 1392-1395. A second failure to break through the key 65 week MA confirms that the intermediate down trend is intact and a retest of 1180 suggests a break of that level is likely.

Today's video for subscribers looks at the recent trading in more detail and our strategy for our next trade.
0 Comments

Gold & Silver Trading Alert: How Will We Know That the Bottom Is In?

21/10/2014

0 Comments

 
Gold & Silver Trading Alert originally published on October 21st, 2014 6:46 AM:

Briefly: In our opinion speculative long positions (half) in gold, silver and mining stocks are justified from the risk/reward perspective.

Yesterday, gold closed higher than it did in the previous several weeks, which seems like a very bullish development for the entire precious metals market until one realizes that miners are still close to their most recent lows.

In short, in our opinion, the answer to the title question is that miners could rally some more in the short term, but we don’t expect the rally to be significant. We expect to see significant rallies after the final bottom is reached (in a few weeks – months), but not before that – at least not based on the information that we have available today. Furthermore, it seems that the next local top will be reached shortly, but that it’s not in just yet.

Why? The USD Index is likely not done declining and the long-term resistance lines in gold have not been reached. What we wrote about these markets yesterday and on Friday remains up-to-date. Still, we would like to show you the latest short-term USD chart as we have added a target area to it (charts courtesy of http://stockcharts.com).
Picture
The target area is relatively close in terms of both time and price. Most of the decline is probably behind us. We have previously written that we expect the USD Index to correct to the 38.2% Fibonacci retracement level and the biggest unknown is what the retracement should be based on – the May-Oct. or Jul.-Oct. rally. The former seems a bit more likely because the 38.2% based on the May-Oct. rally coincides with the 50-day moving average (blue line on the above chart).
Picture
As we have mentioned earlier, gold closed higher once again, which allowed for closing part of the long positions with greater profit yesterday.

As a reminder, we took previous profits off the table by closing short positions on Sep. 25 and we went long with half of the regular position on the same day (gold closed at $1,222.50, but the intra-day low was $1,206.60 and we changed the positions well before the markets closed). On Sep. 30 (when silver was below $17 and gold closed at $1,209.10) we wrote about doubling the long positions.

Yesterday’s move, however, materialized on relatively low volume. It was lowest in a few weeks, so the rally itself was not bullish. The price-volume combination suggests that the rally is running out of steam and the local top is close. This is in tune with what we can infer from the USD Index charts and from the long-term gold chart.
Picture
The USD Index is not the only thing that moves in cycles. The silver market has a cyclical nature as well. The white metal is likely to turn around in the next several days, and the most recent short-term move has been up. Consequently, we are quite likely to see a local top relatively soon.

The declining resistance line is now relatively close – about $0.27 away and more or less at the previous intra-day Oct high. Consequently, we could see the local top more or less at this price level. It seems that it would quite likely coincide with gold moving to its target price.
Picture
Now, in the case of mining stocks, what we see on the above chart per se is less important than what we learn when we compare it with the chart of gold. The above chart tells us that miners rallied yesterday, but the miners-gold link tells us that miners are still weak. This is particularly discouraging because the general stock market moved higher once again yesterday. In other words, we saw Friday’s bearish signal once again – miners did not soar or catch up with gold, even though they “should have”.

Overall, we can summarize the situation in gold, silver and mining stocks in a way that is similar to what we wrote yesterday. However, before we write the final paragraph, we would like to reply to a few questions that we received yesterday.

The first one is “how will you know we reach the final bottom for precious metals and the mining stocks? Will $1,000 and $14 be the final one or could we see a rebound and another plunge lower?” Our reply is similar to what we have written previously. We will be looking for confirmations at these levels. Significant support levels in gold and silver being reached – this is one thing that is likely to be seen at the final bottom, but there are also other things that we would like to see:

- We would like to see USD Index at a major resistance level.

- We would like to see the gold stocks to gold ratio plunge (but we would like gold stocks to show strength after a while, thus refusing to follow gold’s declines).

- We would like to see the silver to gold ratio plunge very visibly (to the point that it’s scary and most investors/traders panic).

- We would like to see websites dedicated to gold freeze for a while when people are so interested in the volatile downswing and keep refreshing these websites for latest prices (did you know that something like that occurred in 2011 right before the final top?).

- We would like to see a very bearish (preferably hateful or otherwise emotional) article on gold in the mainstream media.

- We would like our non-investing friends to call us asking what’s going on with gold as they’ve heard that it has declined so badly.

- We will see other sings that investors and traders sentiment toward gold is very bad.

In other words, we will be looking for confirmations that the bottom is in. The price itself is not enough. At this time it seems that the $1,000 - $1,100 area for gold, $14 - $16 for silver and 150 or so for the HUI Index will stop the decline, but there are no sure bets in any market. We will keep monitoring the situation and report to you accordingly.

The second question that we received is if we will let you know when we think the final bottom is in and if we will plan to take advantage of it using ETFs or quality mining stocks. The answer to the first questions is “yes”. In more detail, we will let you know when we think that the situation looks favorable enough to get back into the precious metals market with the long-term investment capital and when to open speculative long positions. As far as ETFs / mining stocks are concerned, we will quite likely use both.

We will most likely use ETFs / ETNs for speculation in the case of gold and silver (trading capital) and we will use quality mining stocks for investment purposes (individual mining stocks are also useful in the case of speculative trades).

In general - as you have read in the bottom part of each recent alert - we are now out of the precious metals market with the long-term investment capital. The gold & silver portfolio report shows you how the portfolio looked (in case of 3 sample investors: Eric, Jill, and John) before we exited the long-term positions. When we come back to the precious metals market, you can expect a similar structure. We will probably move more into platinum than we will into gold, though.

The third question was what stocks we prefer to buy when we think the bottom is in. The short answer is - the ones with the best outlook. How do we determine that? Using the Golden StockPicker and Silver StockPicker tools. We created these tools a few years ago based on our experience and insights and we have tested their performance several months ago - they have proven to be very helpful in case of both: selecting stocks for speculative trades, and in case of long-term investments.

Each day these tools create rankings of stocks based on their recent performance relative to gold. If they don’t give you the big bang for your gold-and-silver-exposure-seeking buck, stocks rank lower. If they do, and they provide leverage, they rank higher.

There are multiple ways to use these tools, but in short, for long-term investment purposes, the aim - in most cases - is to buy the best 5 stocks and then rebalance them (every 20 trading days in the case of silver stocks and every 50 trading days in the case of gold stocks). This approach created a lot of value as compared to the simple buy-and-hold approach. We conducted  very thorough research on rebalancing mining stocks (the most comprehensive there is, to our knowledge) and you can read the corresponding report in our reports section. The report also features a few approaches regarding speculative purposes. In most cases, selecting top 2 mining stocks seems justified. For instance, take the current/last trade. We wanted to provide you with an example of how the Golden StockPicker works so we saved its results that were based on the Oct. 3 session.

Here’s the input screen:
Picture
Here’s the output screen (top 5 stocks):
Picture
The top 2 gold stocks were: GOLD and RGLD. The above readings were available on Oct. 6 so we will take Oct. 6 and yesterday’s (Oct. 20) closing prices into account. The HUI Index moved from 193.49 to 191.16 (thus moving lower by about 1.2%). At the same time, GOLD moved from $67.23 to $68.55 (thus moving about 2% higher) and RGLD moved from $65.36 to $68.04 (thus moving about 4.1% higher).

Of course, these tools are no crystal balls and they will not select top performers each and every time, but - as we have shown in the rebalancing report - they are very likely to improve the results that one gets on the mining stock trades.

To summarize, when the risk/reward ratio is favorable enough to get back in the precious metals market with the long-term investment capital, Golden StockPicker and Silver StockPicker will provide the mining stock rankings.


Summing up, while the situation in USD Index and in gold and silver suggests higher prices in the short term (not much higher, though), the bearish signal from the mining stocks makes the overall short-term outlook for the precious metals sector less bullish than was the case previously.


(…)


What’s next? We’ll be paying close attention to the events as they unfold and will let you – our subscribers - know when we think further adjustments (either taking the rest of the profits off the table, or adding to / changing positions) are justified from the risk/reward point of view.


To summarize:


Trading capital (our opinion):


It seems that having speculative (half) long positions in gold, silver and mining stocks is a good idea:


·         Gold: stop-loss: $1,172, exit order: $1,257, stop loss for the UGLD ETF $11.29, exit order for the UGLD ETF $13.75

·         Silver: stop-loss: $16.47, exit order: $18.07, stop loss for USLV ETF $23.94, initial target price for the USLV ETF $31.73

·         Mining stocks (price levels for the GDX ETF): stop-loss: $19.94, exit order: $23.37, stop loss for the NUGT ETF $18.25, initial target price for the NUGT ETF $28.99,


In case one wants to bet on higher junior mining stock ETFs, here are the stop-loss details and initial target prices:


·         GDXJ stop-loss: $28.40, exit order: $37.14

·         JNUG stop-loss: $6.19, exit order: $16.34


Long-term capital (our opinion): No positions

Insurance capital (our opinion): Full position


You will find details on our thoughts on gold portfolio structuring in the Key Insights section on our website.


As always, we'll keep our subscribers updated should our views on the market change. We will continue to send them our Gold & Silver Trading Alerts on each trading day and we will send additional ones whenever appropriate. If you'd like to receive them, please subscribe today.


Thank you.


Przemyslaw Radomski, CFA

Founder, Editor-in-chief

Tools for Effective Gold & Silver Investments - SunshineProfits.com

Tools für Effektives Gold- und Silber-Investment - SunshineProfits.DE


* * * * *


Disclaimer


All essays, research and information found above represent analyses and opinions of Przemyslaw Radomski, CFA and Sunshine Profits' associates only. As such, it may prove wrong and be a subject to change without notice. Opinions and analyses were based on data available to authors of respective essays at the time of writing. Although the information provided above is based on careful research and sources that are believed to be accurate, Przemyslaw Radomski, CFA and his associates do not guarantee the accuracy or thoroughness of the data or information reported. The opinions published above are neither an offer nor a recommendation to purchase or sell any securities. Mr. Radomski is not a Registered Securities Advisor. By reading Przemyslaw Radomski's, CFA reports you fully agree that he will not be held responsible or liable for any decisions you make regarding any information provided in these reports. Investing, trading and speculation in any financial markets may involve high risk of loss. Przemyslaw Radomski, CFA, Sunshine Profits' employees and affiliates as well as members of their families may have a short or long position in any securities, including those mentioned in any of the reports or essays, and may make additional purchases and/or sales of those securities without notice.


0 Comments

Gold Market Update - 17th Oct

17/10/2014

0 Comments

 
LONG TERM TREND:                   BEARISH
INTERMEDIATE TERM TREND:     NEUTRAL/BEARISH
SHORT TERM TREND:                 NEUTRAL/BULLISH
VERY SHORT TERM TREND:       BULLISH

The volatility in markets continued yesterday, with equity markets continuing their plunge as worries about Europe persist, US data remains weak and the end of QE rapidly approaches.  However, the mood was dramatically reversed during the US trading session, as Fed spokesman Bullard hinted that the end of QE could be delayed.

This sent stocks and oil soaring, however the reaction in gold was muted - the favoured aset class is clearly still equities.

We maintain our stance that the recent rally in gold is corrective in nature and after an ABC counter trend rally, we expect the decline to resume.

Support can be found at 1235-1238, 1222, 1217, 1203-1205, 1200 and 1180-1183. A break of 1180 would have serious bearish implications for gold and suggest a decline to 1000-1050 in the short term - the failure to break the 65 week MA and the break down of the triangle pattern on the daily chart makes this scenario much more likely, particularly as gold has now reached and tested this crucial support level.

Resistance can be found at 1242, 1250, 1257-1258, 1263, 1271-1273, 1277, 1290-1292, 1300-1302, 1310-1312, 1322-1325, 1333-1335, 1340-1342, 1352-1354 and 1392-1395. A second failure to break through the key 65 week MA confirms that the intermediate down trend is intact and a retest of 1180 suggests a break of that level is likely.

Today's video for subscribers looks at the recent trading in more detail and our strategy for our next trade.
0 Comments

Gold Market Update - 15th Oct

15/10/2014

0 Comments

 
LONG TERM TREND:                   BEARISH
INTERMEDIATE TERM TREND:     NEUTRAL/BEARISH
SHORT TERM TREND:                 NEUTRAL
VERY SHORT TERM TREND:       BULLISH

Since gold bottomed at 1183 last Monday, the price has moved up by well over $50 on the back of tumbling equity markets and a sharp correction in the dollar.  However the dollar has found support just below 86 and weak data from Europe has rekindled buying interest in the greenback.

Gold has corrected this morning, dropping back to 1222 after a strong rally.  We expect the current rally to trace out an ABC correction before the down trend resumes, taking the price of gold back to 1180 and most likely below this level, with our long term 1000 target coming into play.

Whilst equity weakness is supportive for gold, a fully fledged crash would see gold holdings liquidated as panic spread to all markets, however this effect would be temporary and provide a good opportunity to open long positions at much lower levels.

Support can be found at 1222, 1217, 1203-1205, 1200 and 1180-1183. A break of 1180 would have serious bearish implications for gold and suggest a decline to 1000-1050 in the short term - the failure to break the 65 week MA and the break down of the triangle pattern on the daily chart makes this scenario much more likely, particularly as gold has now reached and tested this crucial support level.

Resistance can be found at 1234-1238, 1242, 1257-1258, 1263, 1271-1273, 1277, 1290-1292, 1300-1302, 1310-1312, 1322-1325, 1333-1335, 1340-1342, 1352-1354 and 1392-1395. A second failure to break through the key 65 week MA confirms that the intermediate down trend is intact and a retest of 1180 suggests a break of that level is likely.

Today's video for subscribers looks at the recent trading in more detail and our strategy for our next trade.
0 Comments

Gold Market Update - 13th Oct

13/10/2014

1 Comment

 
LONG TERM TREND:                   BEARISH
INTERMEDIATE TERM TREND:     NEUTRAL/BEARISH
SHORT TERM TREND:                 BEARISH
VERY SHORT TERM TREND:       BULLISH

Gold continued to thrust higher on Friday and this morning the price has hit a high of 1237 before retreating.  We consider this move to be the start of an ABC correction before the down trend reasserts itself and takes gold back down to 1180 and beyond.

The question now is how high the correction goes - we have a number of potential targets which we have shared with subscribers this morning.

Oil is tumbling, now trading well below $85 a barrel, whilst equities and the dollar are also sharply down in the past few trading sessions.  The sell off in equities and the dollar are supporting gold, however we expect this to be short lived.

Support can be found at 1223, 1217, 1203-1205, 1200 and 1180-1183. A break of 1180 would have serious bearish implications for gold and suggest a decline to 1000-1050 in the short term - the failure to break the 65 week MA and the break down of the triangle pattern on the daily chart makes this scenario much more likely, particularly as gold has now reached and tested this crucial support level.

Resistance can be found at 1233, 1237, 1242, 1257-1258, 1263, 1271-1273, 1277, 1290-1292, 1300-1302, 1310-1312, 1322-1325, 1333-1335, 1340-1342, 1352-1354 and 1392-1395. A second failure to break through the key 65 week MA confirms that the intermediate down trend is intact and a retest of 1180 suggests a break of that level is likely.


1 Comment

Gold Market Update - 7th Oct

7/10/2014

0 Comments

 
LONG TERM TREND:                   BEARISH
INTERMEDIATE TERM TREND:     NEUTRAL/BEARISH
SHORT TERM TREND:                 BEARISH
VERY SHORT TERM TREND:       BULLISH

After a stronger than expected Non-Farms Payroll (NFP) number on Friday, the dollar surged higher, almost reaching 87 before finding resistance.  As expected, in the face of such dollar strength gold cratered, tumbling as low as 1183 before finding support at the crucial major support line.

Yesterday gold bounced back as the dollar gave back all of Friday's "knee jerk" reaction gains, highlighting beautifully why one should always be wary of trading on major news days.  We now expect a relief rally towards 1240 before the next leg down which is expected to smash through major resistance at 1180 and see gold fall towards 1000-1050.

Support can be found at 1203-1205, 1200 and 1180-1183. A break of 1180 would have serious bearish implications for gold and suggest a decline to 1000-1050 in the short term - the failure to break the 65 week MA and the break down of the triangle pattern on the daily chart makes this scenario much more likely, particularly as gold has now reached and tested this crucial support level.

Resistance can be found at 1223, 1231, 1235, 1242, 1257-1258, 1263, 1271-1273, 1277, 1290-1292, 1300-1302, 1310-1312, 1322-1325, 1333-1335, 1340-1342, 1352-1354 and 1392-1395. A second failure to break through the key 65 week MA confirms that the intermediate down trend is intact and a retest of 1180 suggests a break of that level is likely.

Today's video for subscribers looks at the recent trading in more detail and our strategy for our next trade.
0 Comments
<<Previous

    Old Posts

    August 2021
    July 2021
    June 2021
    May 2021
    March 2021
    February 2021
    January 2021
    December 2020
    November 2020
    March 2019
    January 2019
    December 2018
    October 2018
    September 2018
    August 2018
    July 2018
    June 2018
    May 2018
    March 2018
    February 2018
    July 2017
    June 2017
    May 2017
    April 2017
    March 2017
    February 2017
    January 2017
    December 2016
    July 2016
    March 2016
    December 2015
    November 2015
    October 2015
    September 2015
    August 2015
    July 2015
    June 2015
    May 2015
    April 2015
    March 2015
    February 2015
    January 2015
    December 2014
    November 2014
    October 2014
    September 2014
    August 2014
    July 2014
    June 2014
    May 2014
    April 2014
    March 2014
    February 2014
    January 2014
    December 2013
    November 2013
    October 2013
    September 2013
    August 2013
    July 2013
    June 2013
    May 2013
    April 2013
    March 2013
    February 2013
    January 2013
    December 2012
    November 2012
    October 2012
    September 2012
    August 2012
    July 2012
    June 2012
    May 2012
    April 2012
    March 2012
    February 2012
    January 2012
    December 2011
    November 2011
    October 2011

UK Gold Trading Experts (UKGTE) is a trading name of Drupac Limited, a company registered in England and Wales (company number 09167819) whose registered office is 1 St. Paul's Square, Birmingham, B3 1QU.