UK Gold Trading Experts
  • Home
  • Trade Like a Pro
  • Gold Blog
  • Subscriber Resources
  • Legal Stuff
    • User Agreement
  • Contact Us

Gold Market Update - 28th Feb

28/2/2014

0 Comments

 
Trade Gold Online Trader
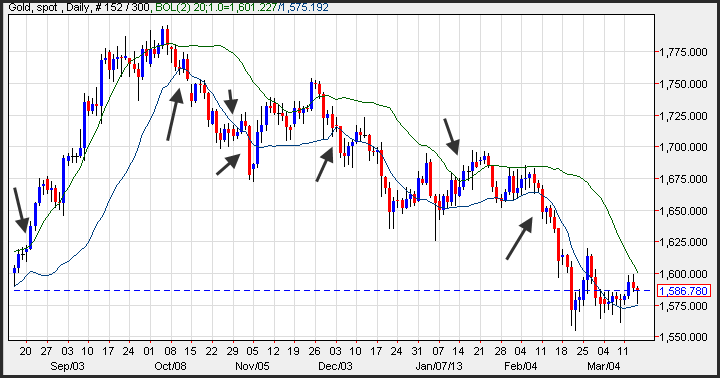
After a strong February performance that has seen gold rise almost $100, the metal is consolidating recent gains and is currently trading around 1325, with the 200 hour MA providing support.

All of the moving averages are pointing upwards and gold is looking in good shape as we enter a strong seasonal period for the yellow metal, with further gains anticipated.

The dollar remains weak and is in danger of dropping through support at 80, oil is still well above $100 a barrel and equities are off all time highs.  Economic news is still mixed and appears to be weaker than a couple of months ago, this uncertainty is also favourable for gold.

Support can be found at 1322, 1312-1315, 1307, 1295-1300, 1280, 1275, 1250-1255, 1237-1240, 1220-1225, 1210, 1200 and 1180.  A break of 1180 would have serious bearish implications for gold and suggest a decline to 1000-1050 in the short
term, though this is looking increasingly unlikely.

Resistance can be found at 1330-1332, 1340, 1350, 1360, 1377-1380, 1395-1400, 1420 and 1435.  The breakout above 1300 suggests an end to the intermediate term down trend and that a significant rally is now developing.

Today's video for subscribers looks at the recent trading in more detail and our


0 Comments

Gold Market Update - 27th Feb

27/2/2014

0 Comments

 
Trade Gold Online Trader
Gold slid yesterday after making a high of 1345, dropping sharply as upward momentum faded.  The charts are now showing a bearish RSI divergence on the daily chart, however gold has found support at the 200 hour MA around 1325 thus far.

The new uptrend is now unmistakeable in gold and we expect further gains after a short correction here, with Wave 3 to take gold much higher.

The dollar found some buying interest yesterday, as did equities, which led to profit taking in gold - it is clear that these two outside markets remain the most important ones to watch at the moment, with the oil price haivng less effect on gold than it usually does.

A break of 80 for the dollar would be very bullish for gold, whilst a break above 81 would cap any gains and put gold under pressure.

Support can be found at 1322, 1312-1315, 1307, 1295-1300, 1280, 1275, 1250-1255, 1237-1240, 1220-1225, 1210, 1200 and 1180.  A break of 1180 would have serious bearish implications for gold and suggest a decline to 1000-1050 in the short term, though this is looking increasingly unlikely.

Resistance can be found at 1330-1332, 1340, 1350, 1360, 1377-1380, 1395-1400, 1420 and 1435.  The breakout above 1300 suggests an end to the intermediate term down trend and that a significant rally is now developing.

Today's video for subscribers looks at the recent trading in more detail and our targets for the next rally phase.

0 Comments

Gold Market Update - 25th Feb

25/2/2014

0 Comments

 
Trade Gold Online Trader
Gold made a solid start to the week, retesting last week's highs at 1340 before finding resistance and backing off into the low 1330s.  It is clear that the bulls now have significant momentum on their side and a break of 1340 should see another leg higher begin in earnest.

We expect a break of 1340 today, or possible tomorrow, as the new major rally starts to build up steam.

The dollar remains weak, a critical factor in gold's recent ascent, and is trading around 80.  With equities well off all time highs, economic news appearing to weaken and oil surging higher, the environment is favourable for gold to move upwards.

Support can be found at 1320, 1312-1315, 1307, 1295-1300, 1280, 1275, 1250-1255, 1237-1240, 1220-1225, 1210, 1200 and 1180.  A break of 1180 would have serious bearish implications for gold and suggest a decline to 1000-1050 in the short term, though this is looking increasingly unlikely.

Resistance can be found at 1330-1332, 1340, 1350, 1360, 1377-1380, 1395-1400, 1420 and 1435.  The breakout  above 1300 suggests an end to the intermediate term down trend and that a significant rally is now developing.

Today's video for subscribers looks at our targets for the next rally leg and our thoughts on gold over the next few trading sessions.

0 Comments

Gold Market Update 24th Feb

24/2/2014

0 Comments

 
Trade Gold Online Trader
After consolidating the breakout from the down trend channel last week, gold has started the current trading week on a positive note, moving above 1330 after a shallow correction that tested the 200 hour MA last week.

The impulsive nature of the January/February rally suggests that gold is embarking on a major new up leg, with a break of 1340 the signal that the next impulsive rise is beginning.

The rally in gold has been characterised by a weak dollar and equities, coupled with a surging oil price.  This combination is exactly what gold requires to move higher and the bulls have finally stepped up to the plate and taken their opportunity, with the bears now in retreat after having their own way for the last year or so.

Support can be found at 1320, 1312-1315, 1307, 1295-1300, 1280, 1275, 1250-1255, 1237-1240, 1220-1225, 1210, 1200 and 1180.  A break of 1180 would have serious bearish implications for gold and suggest a decline to 1000-1050 in the short term, though this is looking increasingly unlikely.

Resistance can be found at 1330-1332, 1340, 1350, 1360, 1377-1380, 1395-1400, 1420 and 1435.  The breakout  above 1300 suggests an end to the intermediate term down trend and that a significant rally is now developing.

Today's video for subscribers looks at the recent trading in more detail and our trategy for our next trade.

0 Comments

Gold Market Update - 21st Feb

21/2/2014

0 Comments

 
Trade Gold Online Trader
Gold tested support at the 200 hour MA yesterday at 1306 before moving higher into the afternoon session.

It is possible that correction is over with that test of an important support level and the rally will now resume, though we suspect that there is another test of 1300 to come first.  Either way, gold appears to be back in full bullish mode, with a powerful new rally leg just underway.

The dollar is still languishing around 80, oil is holding ground above $102 and equities are well off the recent highs after correcting sharply last month.

Support can be found at 1312-1315, 1307, 1295-1300, 1280, 1275, 1250-1255, 1237-1240, 1220-1225, 1210, 1200 and 1180.  A break of 1180 would have serious bearish implications for gold and suggest a decline to 1000-1050 in the short term, though is looking increasingly unlikely.

Resistance can be found at 1325-1330, 1340, 1350, 1360, 1377-1380, 1395-1400, 1420 and 1435.  The breakout  above 1300 suggests an end to the intermediate term down trend and that a significant rally is now developing.

Today's video for subscribers looks at the recent trading in more detail and our targets for the next rally leg in gold.

0 Comments

Gold Market Update - 20th Feb

20/2/2014

0 Comments

 
Trade Gold Online Trader
Gold continued to retrace last week's powerful rally finding support at 1308, just above the 200 hour MA and at the upper boundary of the old uptrend channel that the price broke out of last week.

We expect the market to find support at the 200 hour MA around 1300 before rallying further, with the weak dolar and powerful rally in oil the catalysts.  We must continue to monitor equities, as a renewed rally in stocks will put pressure on the gold price as funds flow away from commodities and back into equities.

Support can be found at 1315, 1295-1300, 1284-1286, 1280, 1270-1275, 1266-1268, 1250-1255, 1237-1240, 1220-1225, 1210, 1200, 1188-1190 and 1180.  A break of 1180 would have serious bearish implications for gold  and suggest a decline to 1000-1050 in the short term, though is looking increasingly unlikely.

Resistance  can be found at 1340, 1326-1330, 1350, 1360 and 1377-1380.  The breakout  above 1300 suggests an end to the intermediate term down trend and that  a significant rally is now developing.

Today's video for subscribers looks at the correction to the recent rally in more detail.

0 Comments

Gold Market Update - 19th Feb

19/2/2014

0 Comments

 
Trade Gold Online Trader
After a powerful rally that took the gold price as high as 1340, profit taking saw the price drop as low as support at 1312 yesterday.  Gold appears to be tracing out an ABC correction from the highs, though we suspect the recent rally is the start of a significant move higher in the yellow metal.

The price is now above all major moving averages and has decisively broken out of the intermediate term down trend channel, with the breach of the 200 DMA a key signal for the bulls.

The dollar remains under pressure, falling below 80 in trading today, whilst oil is surging higher and equities remain well off the recent highs.

Support can be found at 1315, 1295-1300, 1284-1286, 1280, 1270-1275, 1266-1268, 1250-1255, 1237-1240, 1220-1225, 1210, 1200, 1188-1190 and 1180.  A break of 1180 would have serious bearish implications for gold  and suggest a decline to 1000-1050 in the short term, though is looking increasingly unlikely.

Resistance  can be found at 1340, 1326-1330, 1350, 1360 and 1377-1380.  The breakout  above 1300 suggests an end to the intermediate term down trend and that  a significant rally is now developing.

Today's video for subscribers looks at the breakout in more detail and our targets for the ABC correction.

0 Comments

Gold Market Update -18th Feb

18/2/2014

0 Comments

 
Trade Gold Online Trader
Gold moved higher yesterday, despite quiet trading due to the Presidents Day holiday in he US, building on last week's impressive gains.

The price hit a high of 1340 before retreating and this morning is seeing further selling as participants lock in profits from last week.  Gold is now above the key 200 DMA for the first time in a year and all other major moving averages are pointing upwards, suggesting this is the beginning of a new rally phase in gold.

Equities and the dollar remain and weak, whilst the surge in oil has revivied inflation concerns somewhat - a perfect storm for gold to move higher.

The character of the recent rally suggests further gains, as the upleg has been impulsive in nature - we expect higher prices after a brief correction.

Support can be found at 1315, 1295-1300, 1284-1286, 1280, 1270-1275, 1266-1268, 1250-1255, 1237-1240, 1220-1225, 1210, 1200, 1188-1190 and 1180.  A break of 1180 would have serious bearish implications for gold and suggest a decline to 1000-1050 in the short term, though is looking increasingly unlikely.

Resistance can be found at 1340, 1326-1330, 1350, 1360 and 1377-1380.  The breakout above 1300 suggests an end to the intermediate term down trend and that a significant rally is now developing.

Today's video for subscribers looks at the potential targets for a retracement and our thoughts on where gold is headed next.

0 Comments

Gold Market Update - 17th Feb

17/2/2014

2 Comments

 
Trade Gold Online Trader
Gold finished near the highs of the week on Friday, closing above the 200 DMA for the first time in a year and looking likely to see further buying this week.

This morning, gold has got off to a positive start, reaching resistance at 1326-1330 and moving higher along the steep uptrend line.  The recent rally has been impressive and impulsive in nature, with no overlapping waves and a series of progressively higher highs and higher lows.

The tumbling dollar has helped propel gold higher, with anaemic equity markets and a surging oil price helping provide a perfect environment for gold to shine, along with silver.

Support can be found at 1294-1296, 1284-1286, 1280, 1270-1275, 1266-1268, 1250-1255, 1237-1240, 1220-1225, 1210, 1200, 1188-1190 and 1180.  A break of 1180 would have serious bearish implications for gold and suggest a decline to
1000-1050 in the short term, though is looking increasingly unlikely.

Resistance can be found at 1326-1330, 1350, 1360 and 1377-1380.  The breakout above 1300 suggests an end to the intermediate term down trend and that a significant rally is now developing.

Today's video for subscribers looks at the recent rally in more detail and our targets for this rally.

2 Comments

Trade Gold Online - How to Trade Breakouts

14/2/2014

3 Comments

 
Trade Gold Online - How to Trade Breakouts & Triangles
This is another article from our "How to Trade Online" series.

The gold market is a technical market meaning that many of the short term movements of the yellow metal are driven by price action.  The best way to determine the future short term direction of gold prices is to use specific types of techniques that will give you the edge over other traders.  Trading a range or using a specific breakout method can help a trader pinpoint an entry point to initiate a gold position using derivatives instruments such as CFDs, spread bets or binary options.

Technical analysis is the study of price action and can assist a trader with trade entry and risk management. 

There are a number of technical analysis techniques including breakout strategies using ranges as well as triangles which are patterns that will give a gold trader an edge if recognised.

In general gold prices over the long term find a specific direction which will continue to perpetuate over a long period of time.  In the short term, markets move from a consolidative tone to a trend environment back in to a consolidative pattern as investors attempt to jockey for position prior to the next market move. 

Ranges

One of the most efficient ways to trade a breakout of gold prices from price periods which have recently been trading within a range is to use Bollinger bands (first introduced by John Bollinger).  Bollinger bands create a range by showing a distribution of prices based on a specific moving average (10 day moving average of 20-day moving average) and a corresponding standard deviation around that range to incorporate a distribution of prices.
Trade Gold Online - Bollinger Band Breakouts
A breakout of the range created by the Bollinger bands (in this case a 20-day moving average and 1-standard deviation) would be generated when gold prices close above the Bollinger high (for an upward breakout) or below a Bollinger low (for a downward breakdown). 

There are a number of ways to manage risk using this range breakout system.  Some take profit using the moving average, while others look to take profit over a reversal signal.

Triangles

Symmetrical Triangles

Symmetrical triangles are price action that reflects the psychology of indecision. Gold trader’s attempts to push prices higher are quickly met by selling, while drops are seen as buying opportunities. The consolidative tone creates shape of a sideways triangle.  Once gold prices break out, the price action is accompanied by increases in volume.
Trade Gold Online - Symmetrical Triangles
Ascending Triangles

The ascending triangle is a variation of the symmetrical triangle.  Ascending triangles are generally considered bullish and are most reliable when found in an uptrend.  The top part of the triangle appears flat, while the bottom part of the triangle has an upward slant.  Prices usually break through the old highs in an ascending triangle and are accompanied by an increase in volume.
Gold Trading Blog - Ascending Triangles
Descending Triangle

The descending triangle is also a variation.  The descending triangle generally is a bearish pattern and often occurs during a downtrend.  In the descending triangle the bottom part of the triangle appears flat. When the market breaks lower it is accompanied by increases in volume.
How to Trade Gold - Descending Triangles
Break outs and triangles are excellent tools for a trader to use to catch the short term movements within the gold market. Click on the link for more "How to Trade Online" articles.
3 Comments
<<Previous

    Old Posts

    August 2021
    July 2021
    June 2021
    May 2021
    March 2021
    February 2021
    January 2021
    December 2020
    November 2020
    March 2019
    January 2019
    December 2018
    October 2018
    September 2018
    August 2018
    July 2018
    June 2018
    May 2018
    March 2018
    February 2018
    July 2017
    June 2017
    May 2017
    April 2017
    March 2017
    February 2017
    January 2017
    December 2016
    July 2016
    March 2016
    December 2015
    November 2015
    October 2015
    September 2015
    August 2015
    July 2015
    June 2015
    May 2015
    April 2015
    March 2015
    February 2015
    January 2015
    December 2014
    November 2014
    October 2014
    September 2014
    August 2014
    July 2014
    June 2014
    May 2014
    April 2014
    March 2014
    February 2014
    January 2014
    December 2013
    November 2013
    October 2013
    September 2013
    August 2013
    July 2013
    June 2013
    May 2013
    April 2013
    March 2013
    February 2013
    January 2013
    December 2012
    November 2012
    October 2012
    September 2012
    August 2012
    July 2012
    June 2012
    May 2012
    April 2012
    March 2012
    February 2012
    January 2012
    December 2011
    November 2011
    October 2011

UK Gold Trading Experts (UKGTE) is a trading name of Drupac Limited, a company registered in England and Wales (company number 09167819) whose registered office is 1 St. Paul's Square, Birmingham, B3 1QU.