LONG TERM TREND: BEARISH
INTERMEDIATE TERM TREND: NEUTRAL
SHORT TERM TREND: BEARISH
VERY SHORT TERM TREND: NEUTRAL
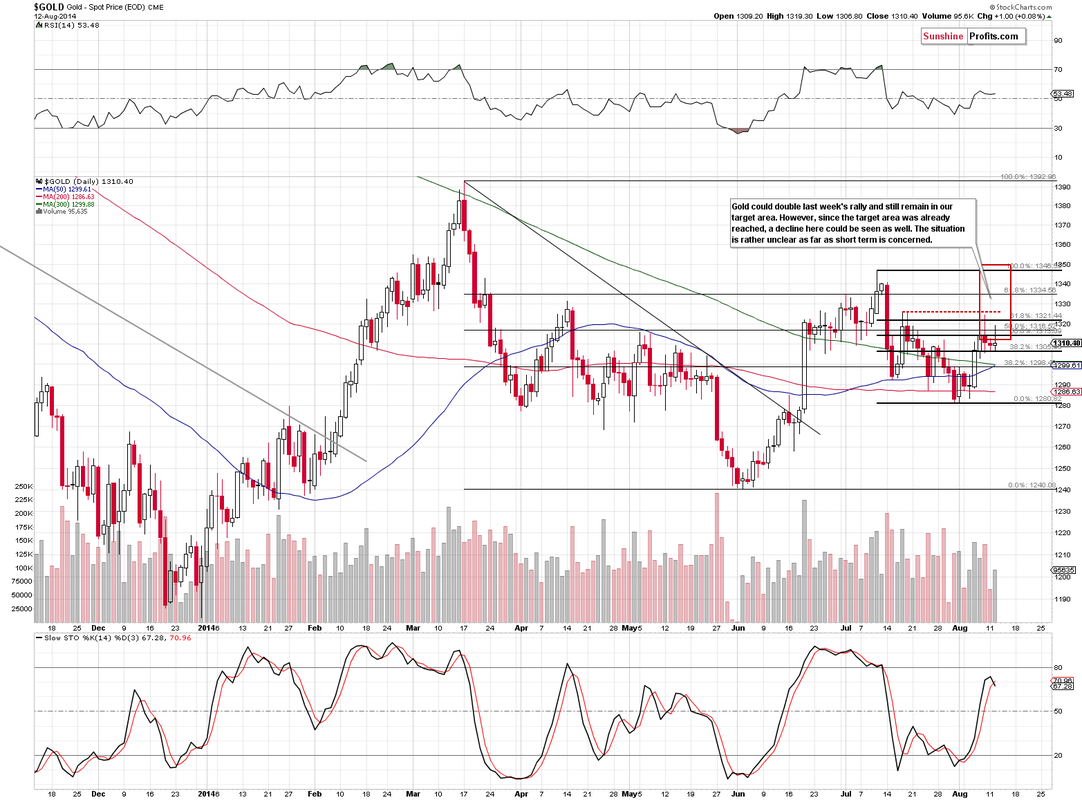
After touching the bottom boundary of the triangle that has been forming on the daily chart during 2014, gold bounced as predicted and found resistance at the convergence of the 20 and 100 DMA at 1296.
This morning, gold is falling and a retest of the lows at 1273 look likely. A break of this level would be a bearish development and suggest a move back towards 1240. However, a break through the confluence of moving averages on the daily chart between 1296 and 1306 would give the bulls some cheer and target a move towards 1325.
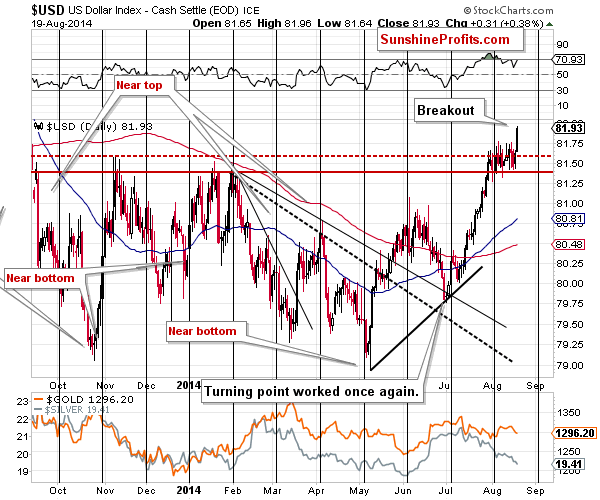
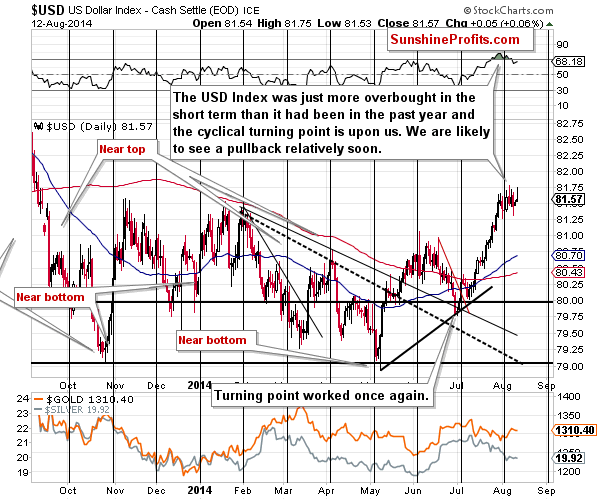
Equities remain at new all time highs and, with the dollar holding above 82.5 and oil floudering far below $100 a barrel, it is not surprising that gold is on the defensive, particularly during the quiet summer months when gold usually drifts downwards - in fact, a case could be made for gold holding up well in the face of such a bearish mix of outside factors.
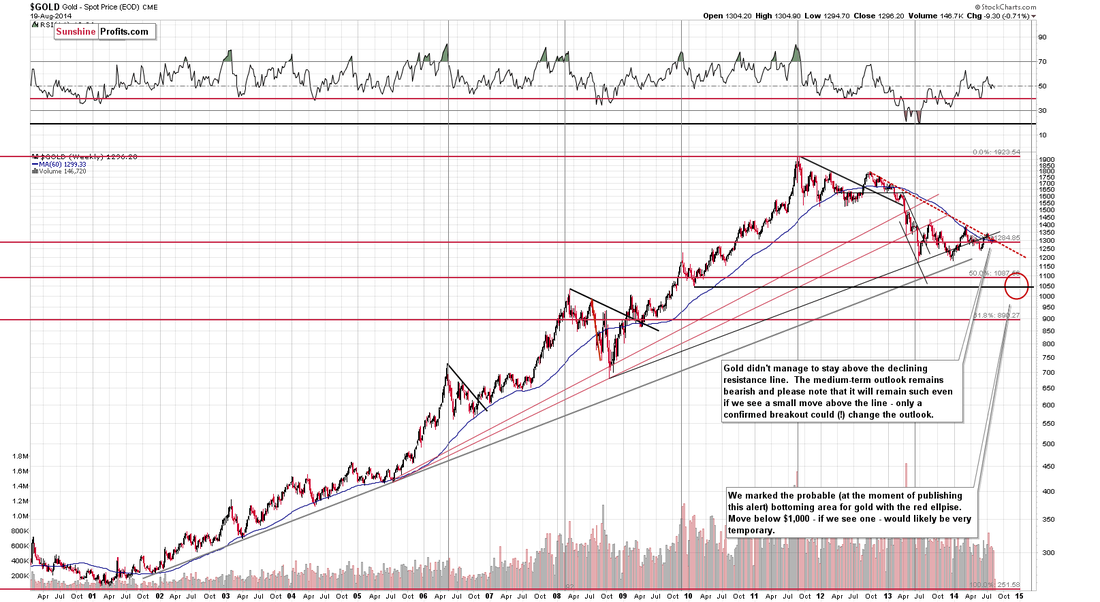
Support can be found at 1283, 1280, 1273, 1263, 1257-1260, 1250-1252, 1237-1240, 1220-1225, 1210, 1200 and 1180. A break of 1180 would have serious bearish implications for gold and suggest a decline to 1000-1050 in the short term - a failure to break the 65 week MA would make this scenario much more likely.
Resistance can be found at 1290-1292, 1300-1302, 1310-1312, 1322-1325, 1333-1335, 1340-1342, 1352-1354, 1392-1395, 1400, 1420 and 1435. A second failure to break through the key 65 week MA would suggest that the intermediate down trend is intact and a retest of 1240 and possibly 1180 is likely.
Today's video for subscribers looks at the recent trading in more detail and our strategy for our next trade.
INTERMEDIATE TERM TREND: NEUTRAL
SHORT TERM TREND: BEARISH
VERY SHORT TERM TREND: NEUTRAL
After touching the bottom boundary of the triangle that has been forming on the daily chart during 2014, gold bounced as predicted and found resistance at the convergence of the 20 and 100 DMA at 1296.
This morning, gold is falling and a retest of the lows at 1273 look likely. A break of this level would be a bearish development and suggest a move back towards 1240. However, a break through the confluence of moving averages on the daily chart between 1296 and 1306 would give the bulls some cheer and target a move towards 1325.
Equities remain at new all time highs and, with the dollar holding above 82.5 and oil floudering far below $100 a barrel, it is not surprising that gold is on the defensive, particularly during the quiet summer months when gold usually drifts downwards - in fact, a case could be made for gold holding up well in the face of such a bearish mix of outside factors.
Support can be found at 1283, 1280, 1273, 1263, 1257-1260, 1250-1252, 1237-1240, 1220-1225, 1210, 1200 and 1180. A break of 1180 would have serious bearish implications for gold and suggest a decline to 1000-1050 in the short term - a failure to break the 65 week MA would make this scenario much more likely.
Resistance can be found at 1290-1292, 1300-1302, 1310-1312, 1322-1325, 1333-1335, 1340-1342, 1352-1354, 1392-1395, 1400, 1420 and 1435. A second failure to break through the key 65 week MA would suggest that the intermediate down trend is intact and a retest of 1240 and possibly 1180 is likely.
Today's video for subscribers looks at the recent trading in more detail and our strategy for our next trade.