
 | Get more free articles like this helping you learn how to trade online. We'd like to help our followers understand how we read the market in a bit more depth; so that you can see why we have so much success calling our trades. In this example, we are going to talk you through a trade we successfully executed in October 2011 for $70 gain over a very quick 4-day period. We used a combination of Fibonacci Retracements and Elliott Wave Analysis to spot the trade and manage it through to a successful conclusion. |
The Set-up
The chart below shows the daily gold market at its close on the 14th October 2011.
Notice the “double top” of price formed between 23rd August and 6th September – whenever you see a double top there is a very strong likelihood that price is going to fall away sharply, especially when it breaks through the low of the dip between the two highs, which is exactly what this did in mid-September (don’t worry, we had some of that action!)
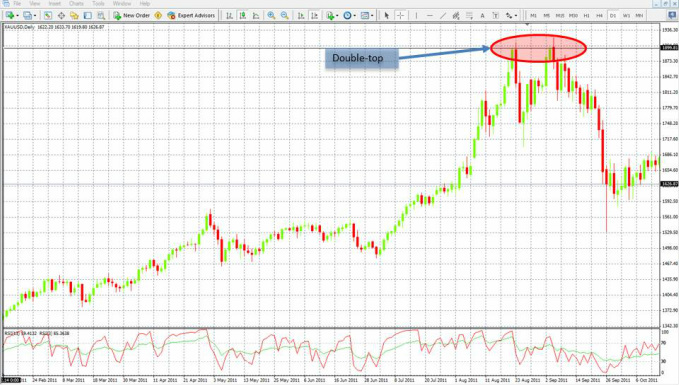
After such a reversal there were two things which were certain. 1, we should be expecting a retracement and 2, we’d entered into a new Elliott Wave cycle. We’ll deal with each separately.
The next chart shows the Fibonacci Retracement drawn from the high on the 6th September down to the low on the 26th September. We felt the retracement was due after the 26th September because of the big pull-back on that day’s price action – price retraced almost $100 in one day!
Based on this we had a 23.6% level of 1622 and a 38.2% level of 1680; and over the next few sessions price rose to test the 38.2 level and then fell back to on or near the 23.6 level which acted as support.
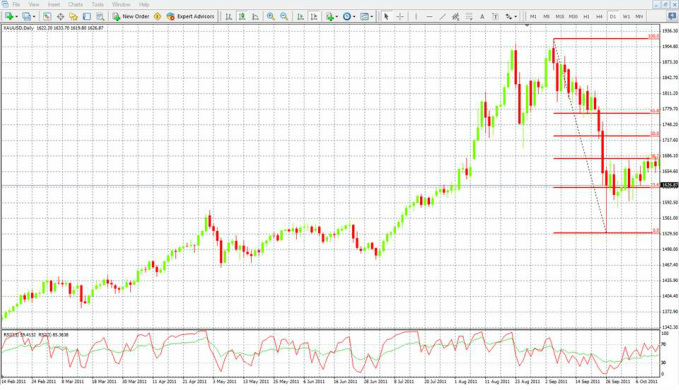
We felt that the market was shaping up nicely for a short trade after five consecutive days where price tested the 38.2 level without dropping back down to the 23.6 – this indicated to us that the 38.2 level was providing some strong resistance and that eventually the price would be attracted back to the 23.6 support level. But trading off of a single indicator alone is a very risky strategy – ideally you need a confluence of indicators, which in this case was provided using Elliott Wave Analysis.
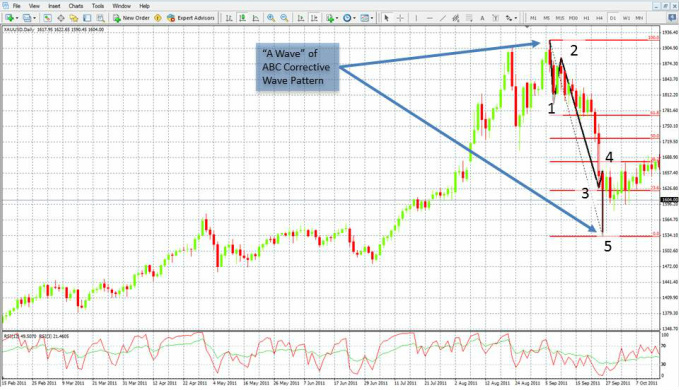
After such a long up-trend we felt that the turnaround following the double-top in early September represented the start of an ABC Elliott Wave corrective pattern.
The chart above shows the completed A wave, which consists of a 5 wave movement (remember that Elliott Waves are patterns within patterns).
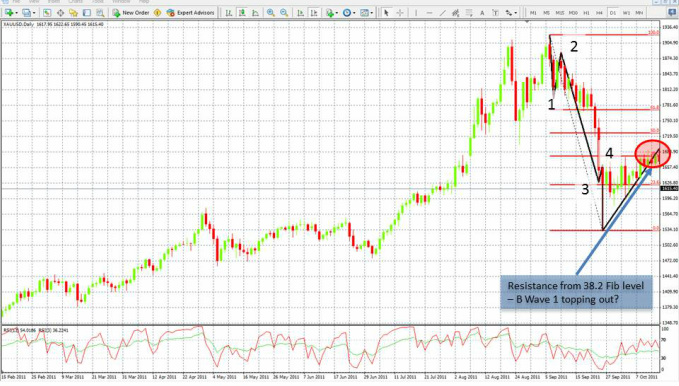
We were obviously expecting a B Wave to follow, which consists of 3 smaller waves. Because of the clear resistance at the 38.2 Fibonacci level (and additional protection of the round number 1700-mark) we felt that the first wave of the B Wave was potentially in and was topping out, as highlighted below, and so were watching and waiting for the right entry point for a short position.
The chart above shows the completed A wave, which consists of a 5 wave movement (remember that Elliott Waves are patterns within patterns).
We were obviously expecting a B Wave to follow, which consists of 3 smaller waves. Because of the clear resistance at the 38.2 Fibonacci level (and additional protection of the round number 1700-mark) we felt that the first wave of the B Wave was potentially in and was topping out, as highlighted below, and so were watching and waiting for the right entry point for a short position.
Entering & Managing the Trade
To help clarify the decision making process, the chart below is shown at the 1-hour timeframe. We were waiting and watching for an entry point, knowing that we were looking to go short based upon the confluence of Elliott Wave and Fibonacci indicators.
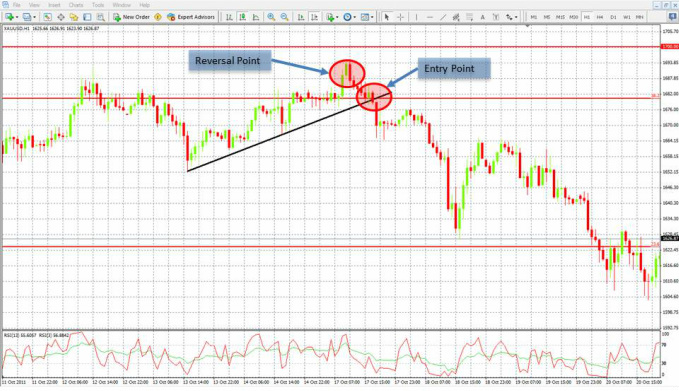
At this level we saw a number of things:
- An up-trend had formed on the hourly chart from 13th October, which intersected the 38.2 Fibonacci level at 1680;
- The up-trend hadn’t managed to make the 1700 resistance level, but had pushed in that direction;
- There was a previous high on 12th October at 1692 which has been tested and held; and
- There was a reversal of the up-trend on the 17th October
These factors led us to believe that 1680 was a good entry point, with a stop-loss $25 away at 1705. Our target was to at least make the 23.6% Fibonacci level at 1622. As soon as price reached 1680 we entered short and then focussed on reducing our risk and locking in profits.
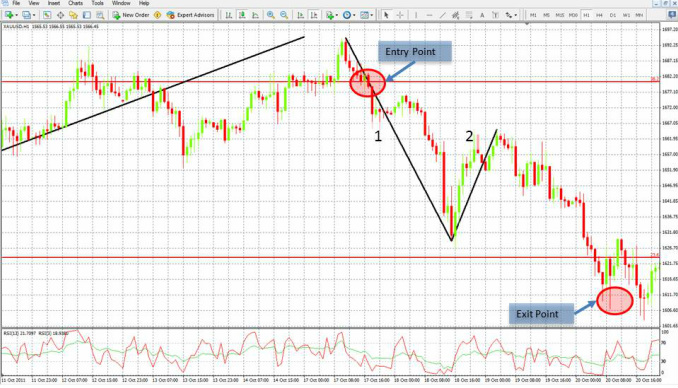
On the chart above we’ve drawn in the first two waves of the second wave in the 3-wave B movement from the ABC corrective wave pattern - remember Elliott Waves are patterns within patterns so we knew this would be a 3-wave move because our trade was based upon the premise that we were entering short to capture the second wave of wave B in an ABC correction, and those waves consist of three smaller waves.
This is important as it allowed us to manage our risk throughout the trade by trailing in the stop loss – initially to a break-even position and then to lock in profits.
Our first move of the stop loss was around lunchtime on the 18th October as price passed the previous low of 1652 from back on the 13th October. Once the low was exceeded, we bought our stop loss in to 1685 to allow a safe pull back to the 38.2 level if we were wrong without being stopped out. That left just $5 on the table, very quickly de-risking the trade.
Our next move of the stop loss was to lock in some profit. This was early in the day on the 19th October after the second wave looked to have topped out at 1665. A double-top had formed and so, when price broke below the low point between the two highs, we moved our stop to 1669 to lock in profits. We chose this point as it was protected by the double-top high of 1665 plus a down-trend had formed from the high of 1676 back on the 18th October and the lower-high of 1665 on the 19th.
The final move of our stop was early on the 20th October after price had broken and held beyond the 23.6 retracement. This meant we’d reached our target and we wanted to a) lock in our profits and b) see what more we could get out of the trade. We moved our stop to 1632 to allow some creep back above the 23.6 level without leaving too much at risk, and were relieved we did so when price reversed a short while later and reached 1626. Thankfully price turned and went in our favour again but we were keen to quickly find an exit, so over the next hour we kept a sharp eye on the price and exited the trade at 1610 as it approached its previous low.
Get more free articles like this helping you learn how to trade online.