UK Gold Trading Experts
  • Home
  • Trade Like a Pro
  • Gold Blog
  • Subscriber Resources
  • Legal Stuff
    • User Agreement
  • Contact Us

Gold Market Update - 26th Sept

26/9/2014

0 Comments

 
LONG TERM TREND:               BEARISH
INTERMEDIATE TERM TREND:  NEUTRAL/BEARISH
SHORT TERM TREND:              BEARISH
VERY SHORT TERM TREND:     NEUTRAL

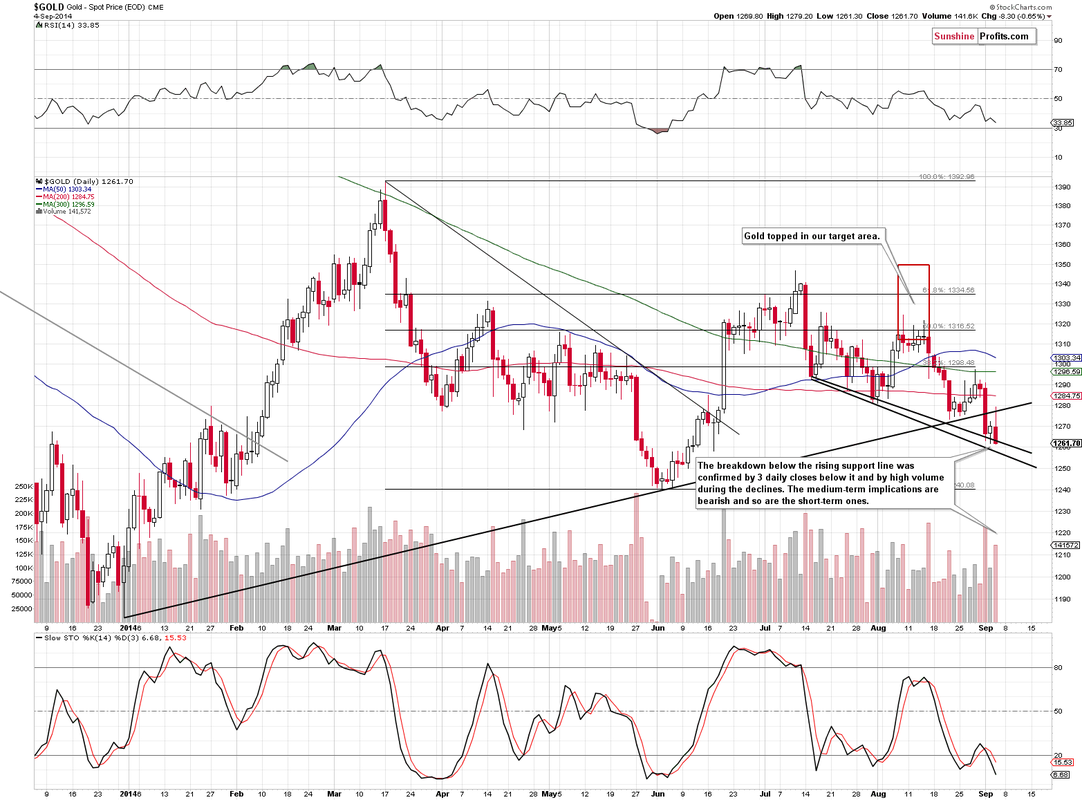
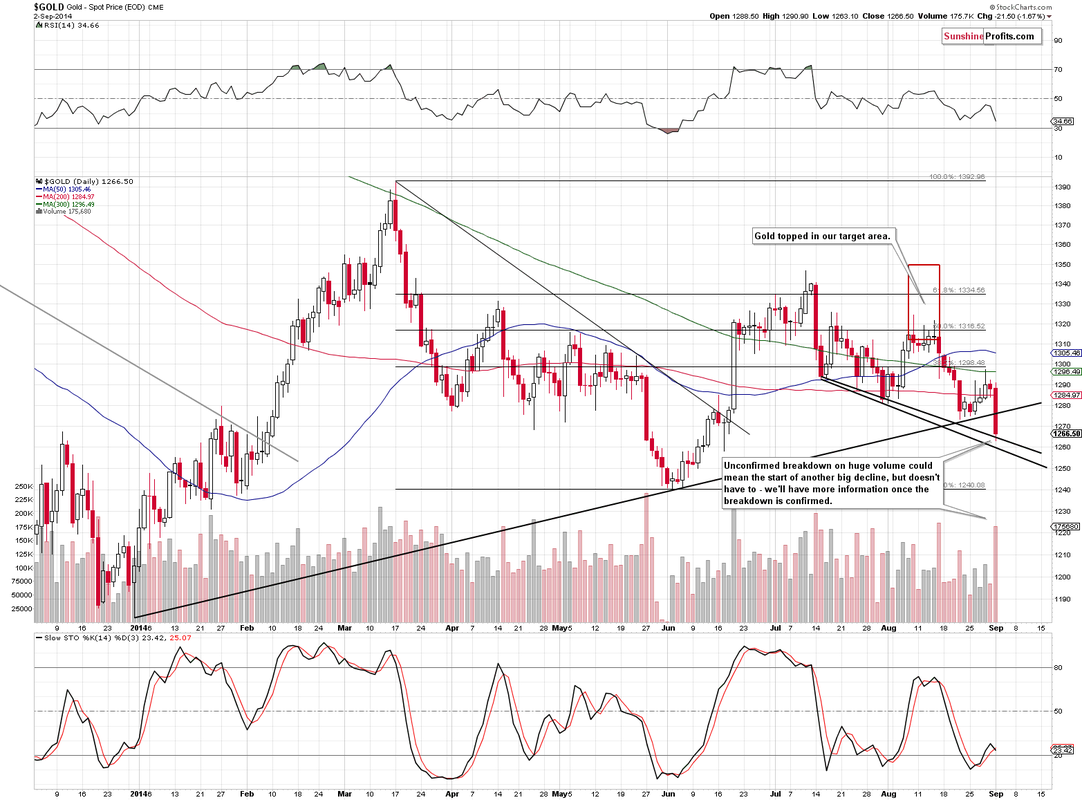
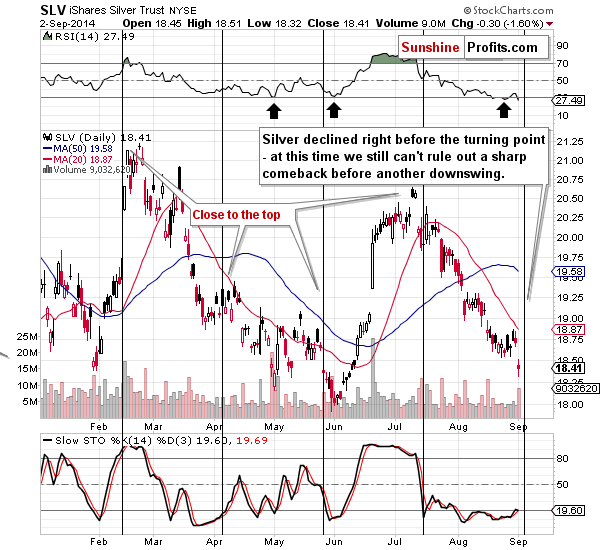
Gold fell as low as 1207 in the early hours of Thursday before rebounding, forming a "double bottom" and a "hammer" reversal on the daily chart.  This morning, gold is building on yesterday's gains and a short term bottom appears to be forming.

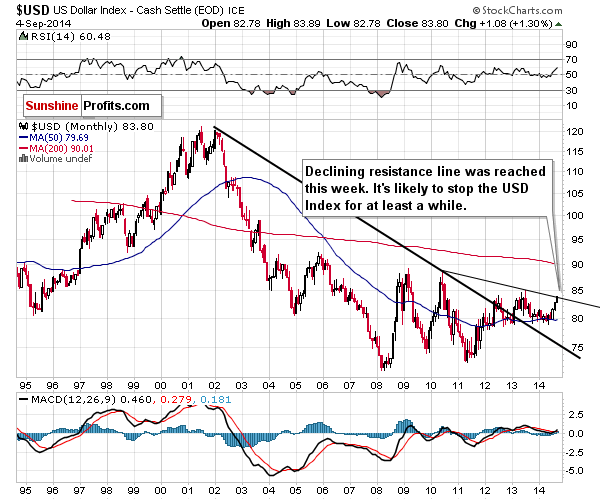
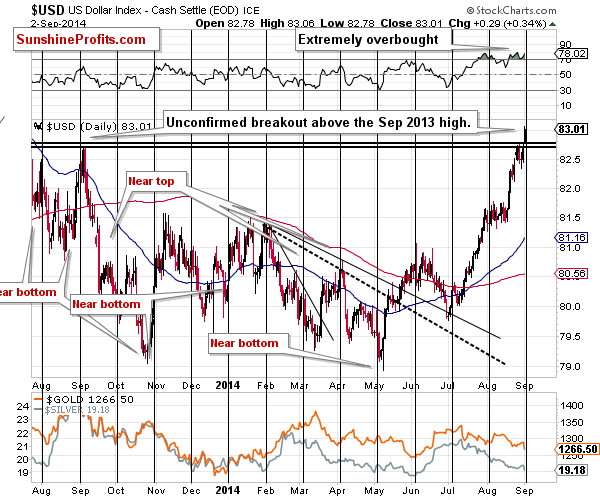
However, the down trend is still firmly in place and we expect the selling to resume after a short rally.  The dollar rally has taken the index well above 85, though ysterday's "shooting star" candlestick suggests a retracement is likely in the short term.

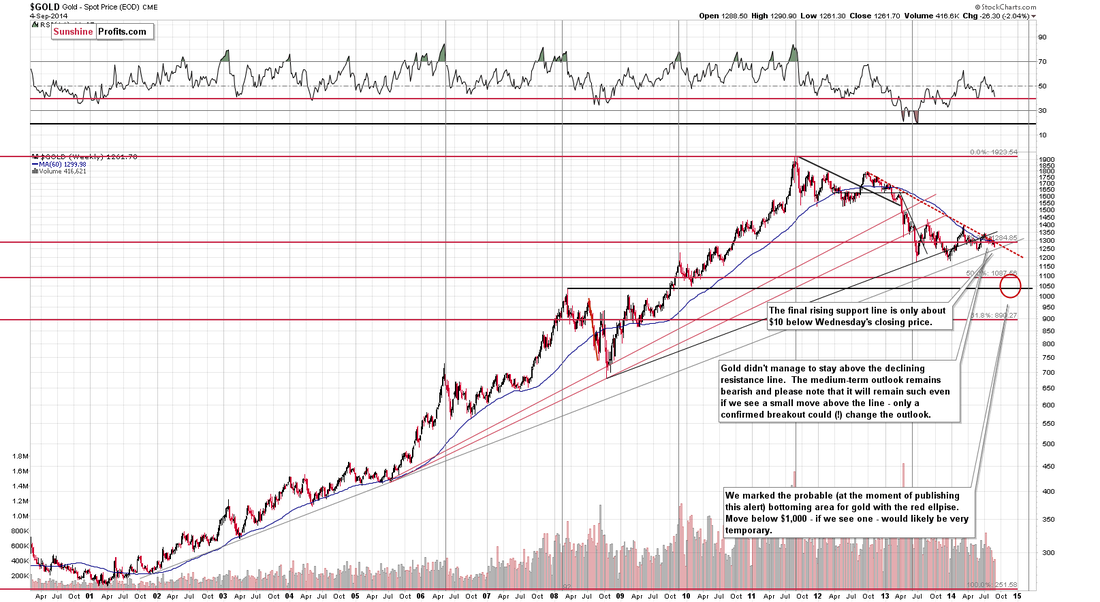
Equities fell sharply yesterday. giving gold a boost though the long term uptrend remains intact.

Support can be found at 1208-1210, 1200 and 1180.  A break of 1180 would have serious bearish implications for gold and suggest a decline to 1000-1050 in the short term - the failure to break the 65 week MA and the break down of the triangle pattern on the daily chart has make this scenario much more likely.

Resistance can be found at 1231, 1235, 1242, 1257-1258, 1263, 1271-1273, 1277, 1290-1292, 1300-1302, 1310-1312, 1322-1325, 1333-1335, 1340-1342, 1352-1354 and 1392-1395.  A second failure to break through the key 65 week MA suggests that the intermediate down trend is intact and a retest of 1180 is now likely.

Today's video for subscribers looks at the recent trading in more detail and our strategy for our next trade.
0 Comments

Gold Market Update - 25th Sept

25/9/2014

0 Comments

 
LONG TERM TREND:                BEARISH
INTERMEDIATE TERM TREND:  NEUTRAL/BEARISH
SHORT TERM TREND:              BEARISH
VERY SHORT TERM TREND:    BEARISH

The rally in gold was short-lived to say the least, with traders pouncing on the opportunity to exit longs as gold surged briefly to 1235 on Tuesday.  That rally has now been retraced in its entirety, with gold breaking below Monday's low at 1208 and looking certain to test 1180 in short order.

As we have been commenting all year, the 1180 level is critical long term support, a break of which would be seriously bearish and suggest a quick return to 1000-1050.  The surging dollar, continuing bull market in equities and collapsing oil price are all adding to the bearish picture for the yellow metal, with geopolitical uncertainty unable to arrest gold's decline.

The bulls will be manning the barricades to hold the 1180-1200 level, we do not expect this level to fail without a fight, however this third test of 1180 is likely to fail eventually.

Support can be found at 1208-1210, 1200 and 1180.  A break of 1180 would have serious bearish implications for gold and suggest a decline to 1000-1050 in the short term - the failure to break the 65 week MA and the break down of the triangle pattern on the daily chart has make this scenario much more likely.

Resistance can be found at 1225, 1240, 1257-1258, 1263, 1271-1273, 1277, 1290-1292, 1300-1302, 1310-1312, 1322-1325, 1333-1335, 1340-1342, 1352-1354 and 1392-1395.  A second failure to break through the key 65 week MA suggests that the intermediate down trend is intact and a retest of 1180 is now likely.

Today's video for subscribers looks at the recent trading in more detail and our strategy for trading this market.
0 Comments

Gold Market Update - 23rd Sept

23/9/2014

0 Comments

 
LONG TERM TREND:                  BEARISH
INTERMEDIATE TERM TREND: NEUTRAL/BEARISH
SHORT TERM TREND:               BEARISH
VERY SHORT TERM TREND:    BEARISH

Gold made a low at 1208 yesterday before bouncing to close near the opening price at 1215, forming a long tailed "doji" candlestick on the daily chart.  This suggests that a bottom may be n place, particularly as gold has moved higher this morning and has broken the steepest down trend line.

We expect a rally here back towards 1250 before the downtrend resumes, with 1180 the next target for the bears.  The recent strong dollar rally is taking a breather and equities are also hovering below all time highs, though the up trends remain intact in both.  Oil is languishing near $91 barrel on Chinese slowing fears,ensuring that inflation remains subdued and interest rate rises less likely.

Support can be found at 1216, 1208-1210, 1200 and 1180.  A break of 1180 would have serious bearish implications for gold and suggest a decline to 1000-1050 in the short term - the failure to break the 65 week MA and the break down of the triangle pattern on the daily chart has make this scenario much more
likely.

Resistance can be found at 1225, 1240, 1257-1258, 1263, 1271-1273, 1277, 1290-1292, 1300-1302, 1310-1312, 1322-1325, 1333-1335, 1340-1342, 1352-1354 and 1392-1395.  A second failure to break through the key 65 week MA suggests that the intermediate down trend is intact and a retest of 1180 is now likely.

Today's video for subscribers looks at the recent trading in more detail and our strategy for our next trade.

0 Comments

Gold Market Update - 19th Sept

19/9/2014

0 Comments

 
LONG TERM TREND:                  BEARISH
INTERMEDIATE TERM TREND:  NEUTRAL/BEARISH
SHORT TERM TREND:                BEARISH
VERY SHORT TERM TREND:     BEARISH

Gold has continued to fall steadily this week, breaking below the 1225 level that has held as support to fall as low as 1216 so far.  The break of 1240 suggests an eventual return to 1180 is now a high likelihood, with a break of this support level a real possibility. 

This would confirm the long term bearish
trend remains intact, with a return to 1000 very likely and even lower prices a possibility.

The dollar strength and continued interest in equities is pressuring gold and the weak oil price is not giving any support to gold.

Support can be found at 1216, 1210, 1200 and 1180.  A break of 1180 would have serious bearish implications for gold and suggest a decline to 1000-1050 in the short term - the failure to break the 65 week MA and the break down of the triangle pattern on the daily chart has make this scenario much more likely.

Resistance can be found at 1225, 1240, 1257-1258, 1263, 1271-1273, 1277, 1290-1292, 1300-1302, 1310-1312, 1322-1325, 1333-1335, 1340-1342, 1352-1354 and 1392-1395.  A second failure to break through the key 65 week MA suggests that the intermediate down trend is intact and a retest of 1180 is now likely.

Today's video for subscribers looks at the recent trading in more detail and our strategy for our next trade.
0 Comments

Gold Market Update - 17th Sep

17/9/2014

0 Comments

 
LONG TERM TREND:                  BEARISH
INTERMEDIATE TERM TREND: NEUTRAL/BEARISH
SHORT TERM TREND:               BEARISH
VERY SHORT TERM TREND:    BEARISH

Gold jumped yesterday on news that the Chinese were introducing Quanititatie Easing, of sorts, however the "knee jerk" response that saw all commodities and equities move higher was shortlived, at least in gold's case.

The market remains in bearish mode, with the sharp sell off since the break down out of the triangle pattern taking the price below 1240, a level that is now acting as resistance in the short term.  Since making a low at 1225, gold has moved hesitantly higher, with long tails on top of the candlesticks on the daily chart suggesting that any rallies are being seen as opportunities to sell and lighten positions.

This does not bode well for the yellow metal and we expect a resumption of the decline once the oversold RSI position has unwound, with 1180 the next target for the bears.

Today sees the FOMC interest rate decision from the US - whilst no change is expected this month, traders will be watching the statement closesly for clues as to when the Fed expects to begin raising rates.

Thursday sees the Scottish independence referendum, with the real possibility of a Yes vote sending jitters through the currency markets.

Support can be found at 1220-1225, 1210, 1200 and 1180.  A break of 1180 would have serious bearish implications for gold and suggest a decline to 1000-1050 in the short term - the failure to break the 65 week MA and the break down of the triangle pattern on the daily chart has make this scenario much more likely.

Resistance can be found at 1240, 1257-1258, 1263, 1271-1273, 1277, 1290-1292, 1300-1302, 1310-1312, 1322-1325, 1333-1335, 1340-1342, 1352-1354, 1392-1395, 1400, 1420 and 1435.  A second failure to break through the key 65 week MA suggests that the intermediate down trend is intact and a retest of 1180 is now likely.

Today's video for subscribers looks at the recent trading in more detail and our strategy for our next trade.
0 Comments

Gold Market Update - 15th Sep

15/9/2014

0 Comments

 
LONG TERM TREND:                  BEARISH
INTERMEDIATE TERM TREND: NEUTRAL/BEARISH
SHORT TERM TREND:               BEARISH
VERY SHORT TERM TREND:    BEARISH

Gold continued to fall steadily last week after breaking down through the lower boundary of the triangle that has formed during 2014 on the daily chart. Gold hit a low of 1225 overnight and has found some support, with the price currently at 1235.

However, the break out of the triangle suggests that the price will eventually make its way down to 1180 and retest that critical support area.  The dollar continues to climb, oil is weak on feeble global demand and equities remain well supported - this contributes to the bearish picture in gold.

This week sees the FOMC meeting in the US that will be closely watched for an indication of when interest rates are likely to rise.  Also the Scottish independance referendum could have a significant impact on currency markets and therefore gold, particularly if the Scots vote to go it alone.

Support can be found at 1220-1225, 1210, 1200 and 1180.  A break of 1180 would have serious bearish implications for gold and suggest a decline to 1000-1050 in the short term - a failure to break the 65 week MA would make this scenario much more likely.

Resistance can be found at 1240, 1257-1258, 1263, 1271-1273, 1277, 1290-1292, 1300-1302, 1310-1312, 1322-1325, 1333-1335, 1340-1342, 1352-1354, 1392-1395, 1400, 1420 and 1435.  A second failure to break through the key 65 week MA would suggest that the intermediate down trend is intact and a retest of 1240 and possibly 1180 is likely.

Today's video for subscribers looks at the recent trading in more detail and our strategy for our next trade.

0 Comments

Gold Market Update - 11th Sept

11/9/2014

0 Comments

 
LONG TERM TREND:                  BEARISH
INTERMEDIATE TERM TREND: NEUTRAL/BEARISH
SHORT TERM TREND:               BEARISH
VERY SHORT TERM TREND:    BEARISH

Gold has declined steadily all week since breaking through the bottom boundary of the triangle pattern on 2 September, finding support yesterday at 1243.  We suspect we may see a small bounce here, which should be seen as an opportunity to reload short positions, however there is a good chance that the gold price continues to slide.

A break of 1240 would be very bearish and suggest a rapid return to retest 1180 is underway, with a break of the key support level at 1180 likely on what would be third attempt.

The dollar strength has been a major factor in gold's recent weakness, with surging equities compounding the misery and a tumbling oil price failing to provide support.  Only a break back into the triangle pattern and a rally to (and ultimately through) the upper boundary would invalidate our bearish stance.

Support can be found at 1243, 1237-1240, 1220-1225, 1210, 1200 and 1180.  A break of 1180 would have serious bearish implications for gold and suggest a decline to 1000-1050 in the short term - a failure to break the 65 week MA would make this scenario much more likely.

Resistance can be found at 1258, 1263, 1271-1273, 1277, 1290-1292, 1300-1302, 1310-1312, 1322-1325, 1333-1335, 1340-1342, 1352-1354, 1392-1395, 1400, 1420 and 1435.  A second failure to break through the key 65 week MA would suggest that the intermediate down trend is intact and a retest of 1240 and possibly 1180 is likely.

Today's video for subscribers looks at the recent trading in more detail and our strategy for our next trade.
0 Comments

Gold Market Update - 8th Sept

8/9/2014

0 Comments

 
LONG TERM TREND:                  BEARISH
INTERMEDIATE TERM TREND: NEUTRAL
SHORT TERM TREND:                BEARISH
VERY SHORT TERM TREND:     BEARISH

Gold was boosted on Friday by a weaker than expected Non Farm Payrolls number from the US that saw the dollar fall as the prospects for an interest rate in the US declined slightly.

However, this morning the bearish trend has reasserted itself, with the dollar finding support after a dramatic gap down in GBP:USD following two opinion polls suggesting that the Sottish independance vote is likely to be very close, with the "Yes" camp taking a slight lead for the first time.

Gold has broken down out of the intermediate term triangle pattern on the daily chart, suggesting a return to 1180 is a likely outcome.  The next level of support is 1240, with little below here before the major support level of 1180.  A break of this level would be seriously bearish, with 1000 likely to be seen in short order if it yields.

The weakness in oil and continued strength in equities and the dollar add to the bearish picture in gold and we see little reason to buy gold at this level.  Only a break back into the triangle pattern and a rally to (and ultimately through) the upper boundary would invalidate our bearish stance.

Support can be found at 1262, 1257-1260, 1250-1252, 1237-1240, 1220-1225, 1210, 1200 and 1180.  A break of 1180 would have serious bearish implications for gold and suggest a decline to 1000-1050 in the short term - a failure to break the 65 week MA would make this scenario much more likely.

Resistance can be found at 1271-1273, 1276-1277, 1290-1292, 1300-1302, 1310-1312, 1322-1325, 1333-1335, 1340-1342, 1352-1354, 1392-1395, 1400, 1420 and 1435.  A second failure to break through the key 65 week MA would suggest that the intermediate down trend is intact and a retest of 1240 and possibly 1180 is likely.

Today's video for subscribers looks at the recent trading in more detail and our strategy for our next trade.
0 Comments

Gold & Silver Trading Alert: Miners Break Down as U.S. Dollar Soars

5/9/2014

0 Comments

 
Gold & Silver Trading Alert originally published on September 5th, 2014 10:20 AM:


Briefly: In our opinion no speculative positions in gold, silver and mining stocks are now justified from the risk/reward perspective. However, day-traders might consider a small speculative long position in silver.


Even though gold didn’t react strongly to Mario Draghi’s comments, a lot happened in the precious metals market yesterday. We finally saw a breakdown in mining stocks and we saw an extreme daily rally in the USD Index. As you know, the USD Index very often triggers significant moves in gold. Even though the last 2 days didn’t bring any changes, the situation has just become very tense for the precious metals investors and traders. What are the implications for your precious metals investments and trades?


Let’s examine the charts and find out (charts courtesy of http://stockcharts.com).


As you know, the USD Index is right at the cyclical turning point (or slightly behind it, which doesn’t change anything), so it’s likely to change its direction. Since it moved above the Sep. 2013 high in a very sharp manner, you might be wondering if there was something important that stopped the rally yesterday and that could prevent further gains for at least a while.
Picture
Yes, there is. The USD Index reached an important long-term resistance line created by major tops – the 2010 high and the 2013 high. In consequence, even though it seems that the only way that the USD can move is up the opposite seems to be much more likely for the short term.


At this point quoting comments from yesterday’s second Gold & Silver Trading Alert is appropriate:


Now, we know that gold hasn't reacted to the dollar's strength, but that doesn't guarantee that it won't react to the dollar's weakness. At this time it might seem that the only direction in which the USD Index can move (given that there are talks in the U.S. about increasing interest rates and the ECB has already lowered rates) is up. That's exactly why… It could correct at this time. Remember that when everyone gets on the same side of the boat, it's better to be on the other side. The cyclical turning point is here and the USD is extremely overbought from the short-term perspective.

Picture
The long-term gold chart features a visible medium-term downtrend, but at the same time it also shows that the long-term support is relatively close. This means that we could see some kind of a pause even if gold is to move a bit lower in the short term. The support is currently [close to] $1,250. 
Picture
On the short-term chart we see that the breakdown was confirmed. The implications are bearish, but given the support present on the long-term chart and the proximity of the June low, we might see only a temporary move lower before another pause.


Since the size of the uncertain (given the situation in the USD Index) decline is not that significant and the chance of a corrective upswing is relatively high (again, because of the USD), it seems better to stay on the sidelines for a few more days. We will know much more once we see how gold reacts to the dollar’s weakness. 

Picture
The situation in the silver market is twice as interesting and critical as in the gold market. The white metal has been consolidating for about a year and the move preceding the consolidation was a sharp and big decline. Once silver breaks below the previous lows, it could drop very far. The support is strong and perhaps that’s why silver is currently more reluctant to decline – it has moved less than gold this week.
Picture
The short-term chart still suggests a turnaround – the white metal is right at its cyclical turning point and is strongly oversold on a short-term basis. Even if we are to see much lower silver prices in the coming weeks (which is likely in our view), the white metal might need to correct – and rally – first.


What about mining stocks?

Picture
We recently wrote that since miners hadn’t moved below the declining support line, the situation hadn’t changed. It changed yesterday. The breakdown materialized on high volume, which is a bearish sign. The size of the decline and the miners’ underperformance relative to gold is also notable. Does the significance of the daily underperformance mean anything?

Picture
Not really. On the above chart we compared the prices of the HUI Index (gold stocks) with the price of gold and marked times when short-term declines in the ratio were particularly sharp (the Rate of Change indicator in the lower part of the chart was below 5). It turns out that this type of movement used to happen in the first days of declines, but also in the final days. Consequently, the fact that miners moved lower relative to gold at such a high pace doesn’t make the outlook clearer.
Picture
Comparing gold stocks to oil stocks, however, provides meaningful medium-term implications. It seems that the local top is already in as the ratio moved slightly above its 20-week moving average and reversed direction. This is the kind of action that preceded the late-2012 high and the early-2014 high. Please note that there was only one additional huge rally in the ratio – from late-2000 to late-2003 and during this time the 20-week moving average did a good job showing the true direction of the move – the move ended once the average was successfully broken in early 2014. The ratio was not broken recently, and the medium-term trend remains down.


Summing up, the situation in the precious metals market is very tense. The medium-term trend remains down and we saw breakdowns in gold, silver and mining stocks, but at the same time the situation in the USD Index (which has been a major factor in determining the PMs’ and miners’ price swings) suggests that we could see a corrective upswing.


The most important thing is that the situation doesn’t really impact the medium-term outlook (after all, long-term investments are usually the biggest part of one’s portfolio), which remains bearish. The situation is only very tense for the short term. In this case, it seems that waiting on the sidelines is still appropriate – when in doubt, stay out.


To summarize:


Trading capital (our opinion): No positions

Long-term capital (our opinion): No positions

Insurance capital (our opinion): Full position


You will find details on our thoughts on gold portfolio structuring in the Key Insights section on our website.


As always, we'll keep our subscribers updated should our views on the market change. We will continue to send them our Gold & Silver Trading Alerts on each trading day and we will send additional ones whenever appropriate. If you'd like to receive them, please subscribe today.


Thank you.


Przemyslaw Radomski, CFA

Founder, Editor-in-chief

Tools for Effective Gold & Silver Investments - SunshineProfits.com

Tools für Effektives Gold- und Silber-Investment - SunshineProfits.DE


* * * * *


Disclaimer


All essays, research and information found above represent analyses and opinions of Przemyslaw Radomski, CFA and Sunshine Profits' associates only. As such, it may prove wrong and be a subject to change without notice. Opinions and analyses were based on data available to authors of respective essays at the time of writing. Although the information provided above is based on careful research and sources that are believed to be accurate, Przemyslaw Radomski, CFA and his associates do not guarantee the accuracy or thoroughness of the data or information reported. The opinions published above are neither an offer nor a recommendation to purchase or sell any securities. Mr. Radomski is not a Registered Securities Advisor. By reading Przemyslaw Radomski's, CFA reports you fully agree that he will not be held responsible or liable for any decisions you make regarding any information provided in these reports. Investing, trading and speculation in any financial markets may involve high risk of loss. Przemyslaw Radomski, CFA, Sunshine Profits' employees and affiliates as well as members of their families may have a short or long position in any securities, including those mentioned in any of the reports or essays, and may make additional purchases and/or sales of those securities without notice.

0 Comments

Gold & Silver Trading Alert: Gold’s Plunge, Dollar, and CCI

3/9/2014

0 Comments

 
Gold & Silver Trading Alert originally published on September 3rd, 2014 6:28 AM:

Briefly: In our opinion no speculative positions in gold, silver and mining stocks are now justified from the risk/reward perspective. However, day-traders might consider a small speculative long position in silver.

The precious metals sector moved sharply lower yesterday – in tune with its medium-term trend. The decline was to a large extent connected with the breakout in the USD Index. It seems that it is the U.S. dollar that will determine the short-term moves in PMs and miners in the coming days and in today’s alert we focus on this relationship. The CCI Index seems to be in a particularly interesting position as well and this is something that gold & silver traders should be aware of.


Let’s start with the USD Index chart (charts courtesy of http://stockcharts.com).
Picture
The USD Index moved higher once again – this time it managed to move above the Sep. 2013 high. The RSI indicator suggests an extremely overbought condition and the cyclical turning point is upon us. The combination of the above suggests that a corrective downswing has become very likely.

The breakout indeed materialized yesterday, but it has not been confirmed yet (only 1 daily close above the Sep. 2013 high and we would like to see 3 of them before saying that the move is confirmed), which means that this makes the situation only a little more bullish. The combination of these factors seems more important than the unconfirmed breakout, so it seems quite likely that we will see a move lower shortly.

In yesterday’s Forex Trading Alert we commented on the possible reversal in the currency markets this week:

Please note that we will have a decision or at least more information regarding the European QE on Thursday - perhaps this will be the day when currencies reverse their direction for some time. We will keep our eyes open and report to you accordingly.

It could be the case that even if the decision that will be made on Thursday is bullish for the USD Index (big QE in Europe), we could see a “sell rumor but buy the fact” type of reaction. In other words, given the significantly overbought situation in the USD Index and the proximity of the turning point, we could see a reversal no matter what the officials say on Thursday.

The unconfirmed breakout in the USD Index translated into an unconfirmed breakdown in gold.
Picture
The decline in gold took place on huge volume which is a bearish factor, but, just as it was the case with the USD Index, until we see a confirmation of the breakdown, we shouldn’t get too excited. Yes, in our opinion the medium-term trend remains down, so the surprises will be to the downside, but at this time it’s not that certain that the decline has already begun. The breakdown (below the previous lows and the rising medium-term support line) is not confirmed at this time and gold hasn’t moved below the declining support line (the upper of them, based on the daily closing prices).

In other words, if the USD Index corrects, then we will be likely to see gold move higher in the short term. If, given the correction, gold stays above the rising support/resistance line, we will have a good possibility that the next big downswing will already be underway and it will probably be a great time to enter a short position.

While we’re at discussing the gold-USD link, we were asked if there [was] a chance that we could see a month long rally in gold with the likelihood of a falling dollar as we [were] at the cyclical turning point. In our opinion such possibility exists, but yesterday’s big-volume decline made it more probable that we will see a rather limited upswing. If gold soars more than $100 or so and mining stocks also rally, then it could change the medium-term picture to bullish. At this time, however, the volume suggests something opposite – we have been seeing higher volume with lower prices and low volume with higher prices. We will be monitoring the markets for signs of significant strength and report to you if we see them. For now – we think the medium-term remains bearish.
Picture
Commenting yesterday’s SLV chart we wrote that “we [could] expect the volatility to increase in the coming days based on silver’s cyclical turning point” and we didn’t have to wait long for this to become reality. However, the move lower might not be the thing that was likely to take place based on the turning point – since silver is still before it, we could actually see a sharp upswing based on it. In fact, it still seems quite likely given the situation in the USD Index. Also, please note that the RSI indicator is once again oversold, which has previously meant that we were at a local bottom or a very close to one.

Our yesterday’s comments remain up-to-date:

The most interesting thing about the turning points in the USD and silver is that the one in silver is several days behind the one in the dollar. This paints a picture in which the USD Index declines first, causing silver and the rest of the precious metals sector to rally, perhaps sharply, but then silver’s turning point “kicks in” and metals and miners reverse and start declining. Let’s keep in mind that silver tends to outperform in the final part of a given upswing, so we could see a jump in the price of the white metal right before a downturn. Naturally, there are no guarantees that the above scenario will be realized, but it seems quite likely in our view.

What can we infer from the mining stocks chart?
Picture
Not much. The decline hasn’t taken mining stocks below the declining support line, which means that there has been no breakdown. Therefore, the situation hasn’t really changed based on yesterday’s decline. We could still see some short-term strength, based mainly on the buy signal from the Stochastic Indicator. Similarly, to what we’ve seen in gold, the volume on which miners rallied last week was small, suggesting that this rally was just a temporary phenomenon.

Before summarizing, we would like to reply to another question that we have just received and we would like to provide you with one additional chart.

We were asked about our best approximation of the HUI Index if Dow was at 17,000 and gold at $1,100. Of course, there are no guarantees, but our best bet at this time is 150. The 17,000 assumption about the Dow doesn’t change much, as the HUI to gold ratio managed to slide in the past 2 years despite the rally in the former (despite short-term upswings, that is). It seems quite likely to us that when the precious metals sector finally bottoms, the HUI to gold ratio will move to its 2000 and 2009 lows – close to the 0.13 level. Multiplying this by 1,100 leaves us with 143 and 150 is the strong support that is closest to this level. 
Picture
The CCI Index (proxy for the commodity sector) has just moved to the major, long-term support and stopped the decline at this level. That’s the upper part of our target area for this index – the one that we featured weeks ago. The commodity sector is likely to at least take a breather before declining once again, and this is a short-term bullish sign for gold as well.


Summing up, while the medium-term has been down, the short-term outlook for the precious metals sector seems rather favorable based on the extremely overbought situation in the USD Index. The latter is likely to correct sooner rather than later based i.a. on its cyclical turning point and it’s quite likely that it will cause a move higher in PMs and miners.


To summarize:


Trading capital (our opinion): No positions

Long-term capital (our opinion): No positions

Insurance capital (our opinion): Full position


You will find details on our thoughts on gold portfolio structuring in the Key Insights section on our website.


As always, we'll keep our subscribers updated should our views on the market change. We will continue to send them our Gold & Silver Trading Alerts on each trading day and we will send additional ones whenever appropriate. If you'd like to receive them, please subscribe today.


Thank you.


Przemyslaw Radomski, CFA

Founder, Editor-in-chief

Tools for Effective Gold & Silver Investments - SunshineProfits.com

Tools für Effektives Gold- und Silber-Investment - SunshineProfits.DE


* * * * *


Disclaimer


All essays, research and information found above represent analyses and opinions of Przemyslaw Radomski, CFA and Sunshine Profits' associates only. As such, it may prove wrong and be a subject to change without notice. Opinions and analyses were based on data available to authors of respective essays at the time of writing. Although the information provided above is based on careful research and sources that are believed to be accurate, Przemyslaw Radomski, CFA and his associates do not guarantee the accuracy or thoroughness of the data or information reported. The opinions published above are neither an offer nor a recommendation to purchase or sell any securities. Mr. Radomski is not a Registered Securities Advisor. By reading Przemyslaw Radomski's, CFA reports you fully agree that he will not be held responsible or liable for any decisions you make regarding any information provided in these reports. Investing, trading and speculation in any financial markets may involve high risk of loss. Przemyslaw Radomski, CFA, Sunshine Profits' employees and affiliates as well as members of their families may have a short or long position in any securities, including those mentioned in any of the reports or essays, and may make additional purchases and/or sales of those securities without notice.


0 Comments
<<Previous

    Old Posts

    August 2021
    July 2021
    June 2021
    May 2021
    March 2021
    February 2021
    January 2021
    December 2020
    November 2020
    March 2019
    January 2019
    December 2018
    October 2018
    September 2018
    August 2018
    July 2018
    June 2018
    May 2018
    March 2018
    February 2018
    July 2017
    June 2017
    May 2017
    April 2017
    March 2017
    February 2017
    January 2017
    December 2016
    July 2016
    March 2016
    December 2015
    November 2015
    October 2015
    September 2015
    August 2015
    July 2015
    June 2015
    May 2015
    April 2015
    March 2015
    February 2015
    January 2015
    December 2014
    November 2014
    October 2014
    September 2014
    August 2014
    July 2014
    June 2014
    May 2014
    April 2014
    March 2014
    February 2014
    January 2014
    December 2013
    November 2013
    October 2013
    September 2013
    August 2013
    July 2013
    June 2013
    May 2013
    April 2013
    March 2013
    February 2013
    January 2013
    December 2012
    November 2012
    October 2012
    September 2012
    August 2012
    July 2012
    June 2012
    May 2012
    April 2012
    March 2012
    February 2012
    January 2012
    December 2011
    November 2011
    October 2011

UK Gold Trading Experts (UKGTE) is a trading name of Drupac Limited, a company registered in England and Wales (company number 09167819) whose registered office is 1 St. Paul's Square, Birmingham, B3 1QU.