UK Gold Trading Experts
  • Home
  • Trade Like a Pro
  • Gold Blog
  • Subscriber Resources
  • Legal Stuff
    • User Agreement
  • Contact Us

Gold Market Update - 30th Nov

30/11/2012

0 Comments

 
Gold recovered well yesterday in tentative trading after Wednesday's plunge.  The yellow metal is currently trading around 1730, knocking on the door of the resistance area from the last couple of weeks.

We believe gold will break back through this resistance and the 50 DMA, possibly today, and move towards 1755 again.  Once through there, 1800 should quickly come back into range.

For our subscribers at www.goldtradingexperts.com, today's video looks at the recovery from Wednesday's lows at 1705 and an important trend line on the daily chart.
0 Comments

Gold Market Update - 29th Nov

29/11/2012

0 Comments

 
In what can only be explained by options expiry related trades, gold plunged $25 in a matter of seconds on the COMEX open yesterday,  taking everyone by surprise.

However gold found support at 1705, forming a "triple bottom" on the charts and has since recovered well off the lows.  The market is back below the 1730-1738 resistance level which proved so difficult to break previously, though the bullish trend remains intact as long as the price of gold remains above 1700.

For our subscribers at www.goldtradingexperts.com, today's video looks at yesterday's price plunge in more detail and our reaction to it.
0 Comments

Gold Market Update - 28th Nov

28/11/2012

0 Comments

 
No surprise that gold closed below 1750 yesterday, meaning al lof the 1750 December calls expire worthless.

Gold has drifted lower overnight to test the top of the solid support zone at 1738 and the uptrend support line as well.

We expect the price to move higher from here after a successful test of the support zone at 1730-1738.  Initial resistance lies at 1755, then major resistance can be found just below 1800.

For our subscribers at www.goldtradingexperts.com, today's video looks at the action of the previous couple of trading sessions and our strategy for the next week or two.
0 Comments

Gold Market Update - 27th Nov

27/11/2012

0 Comments

 
Gold traded in a tight $6 range yesterday, capped at 1750 in advance of options expiry today.  We may see some sharp oscillations later in the session as traders roll out of December contracts and into February contracts and option traders hedge and square their positions.

We expect the price to close just below 1750 today, which would see all of the 1750 December calls expire worthless,as well as those with a higher strike price (particularly 1800).

For our subscribers at www.goldtradingexperts.com, today's video looks at the "bigger picture" and what we can expect in terms of volatility and price movements in the next few months.
0 Comments

Gold Market Update - 26th Nov

26/11/2012

0 Comments

 
We were expecting a quiet, post-Thanksgiving slumber on Friday, and for most of the day this was what we got.

However, in the afternoon session, gold exploded out of the "flat topped triangle" we had identified previously, smashing through stubborn resistance at 1738 and moving all the way up to 1755 where it found some sellers.

Gold has held onto the gains overnight and the 1730-1738 zone now becomes solid support.  Assuming the gains of Friday are held, we expect the market to move towards 1800 now, with resistance expected at 1755-1760.

For our subscribers at www.goldtradingexperts.com, today's video looks at Friday's price action in more detail and the "bigger picture" and our expectations for the rest of the year.
0 Comments

The Roadmap to New Highs in 2013

26/11/2012

26 Comments

 
Picture
Gold has been in a bull market for the last 12 years with year-on-year gains in every calendar year since 2001.  We believe that this bull market has a lot further to go, though we expect a top of some significance in 2013, year 13 of the rally (13 is a Fibonacci number).

After a significant correction, we then expect the gold price to move higher again in another multi-year rally, taking us to a major top in 2022, a 21 year super rally in precious metals the like of which the world has never seen before.

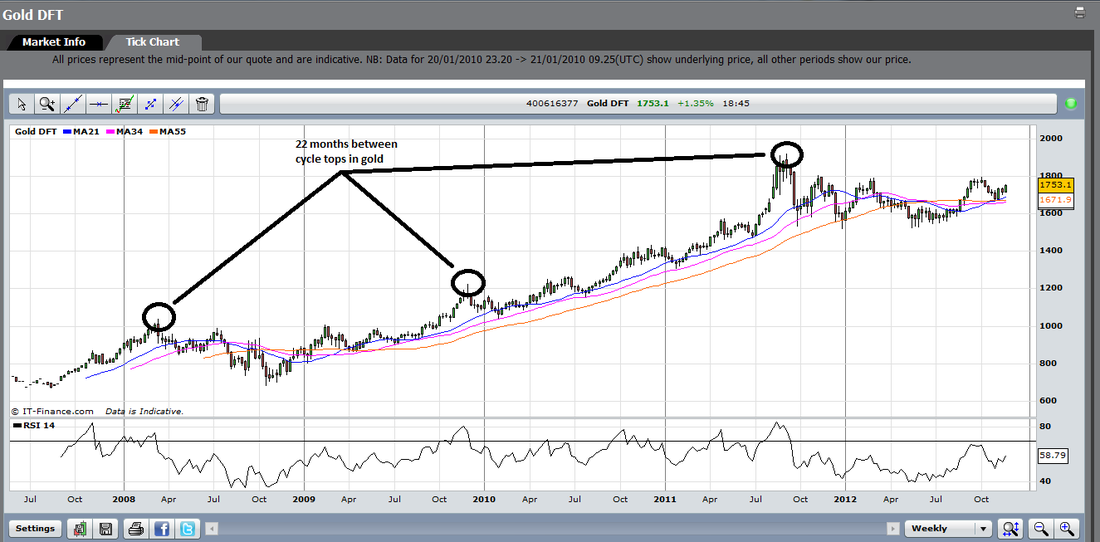
It is clear from the chart below that gold makes a cyclical top every 22 months.  The last such major top was in August/September 2011, giving us our next cyclical top in June/July 2013

Picture
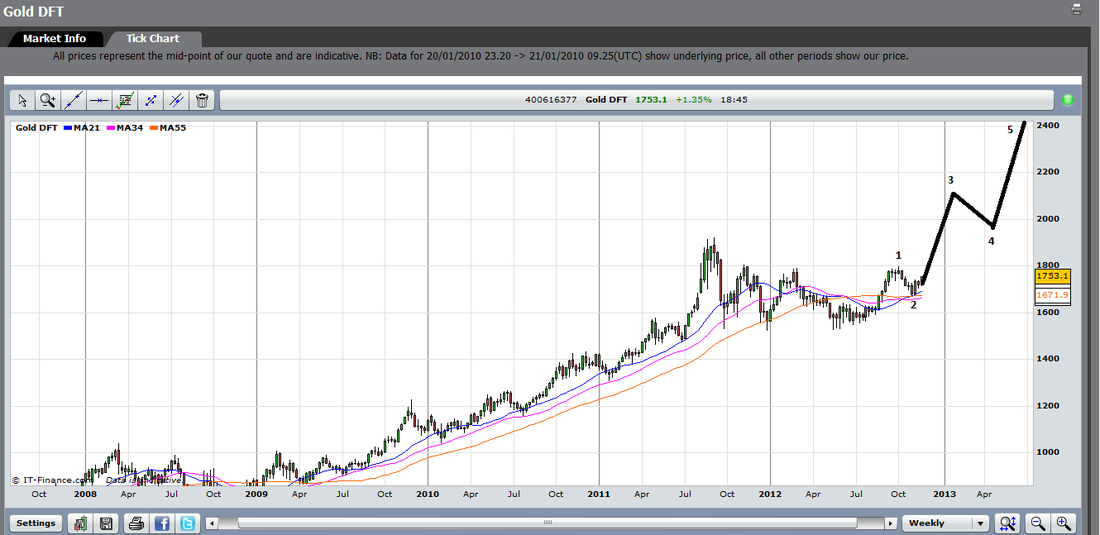
From an Elliot Wave perspective, we were in a Wave 4 corrective triangle from this top in September 2011 until we broke out of the triangle in August 2012 and began a Wave 5 rally.

We believe that we have completed Waves 1 and 2 of this final rally leg and have just started Wave 3.  This means that we have Wave 3, 4 and 5 to complete the pattern and take us to the cyclical high in June/July 2013.

The chart below shows how we expect the price to move over the next 7 months to arrive at our projected top at $2,400.
Picture
Following this, we then expect a significant correction to unfold in gold and silver which will take gold prices back to $1,300-$1,500 before the next major rally begins.

Subscribers to our paid service at www.goldtradingexperts.com/our-products.html get our support and insight every day to help trade this market successfully as these major plays unfold. 

Since starting the service in October 2011 we have helped our subscribers gain over $400 (equivalent to 4,000 points/ pips), which is an impressive return considering we've been trading throughout a choppy period of consolidation - as the major moves we are predicting become reality we'd expect our returns to be even more impressive.
26 Comments

Gold Increases Due Weak Dollar & Technical Buying

24/11/2012

0 Comments

 
Friday's gold price action may have surprised many gold traders who were expecting another quiet day as the US Thanksgiving weekend continued, but to us it provided a great example of converging factors having a major impact on the gold price.

Most people know that when the dollar weakens against other currencies, the price of gold tends to increase.  This is simple economics - gold is priced in dollars and so when the dollar is worth less you get more bang for your buck, which in turn drives up the price of gold due to the increased demand.

Gold has been range-bound since early November, trading between $1700 and $1738.  Since the end of last week gold has built a solid base between $1720 and $1730, but couldn't find the momentum to carry beyond the strong resistance around $1734-$1738.  This price action resulted in an upwards triangle pattern and, in an upside break, when the price breaks out of the triangle it tends to go with some gusto.

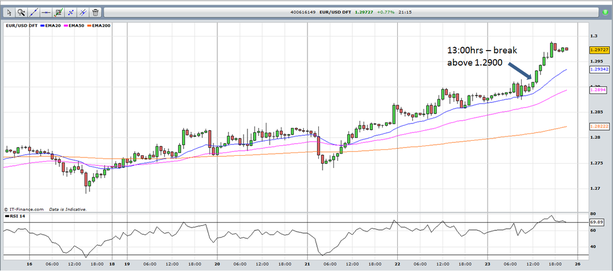
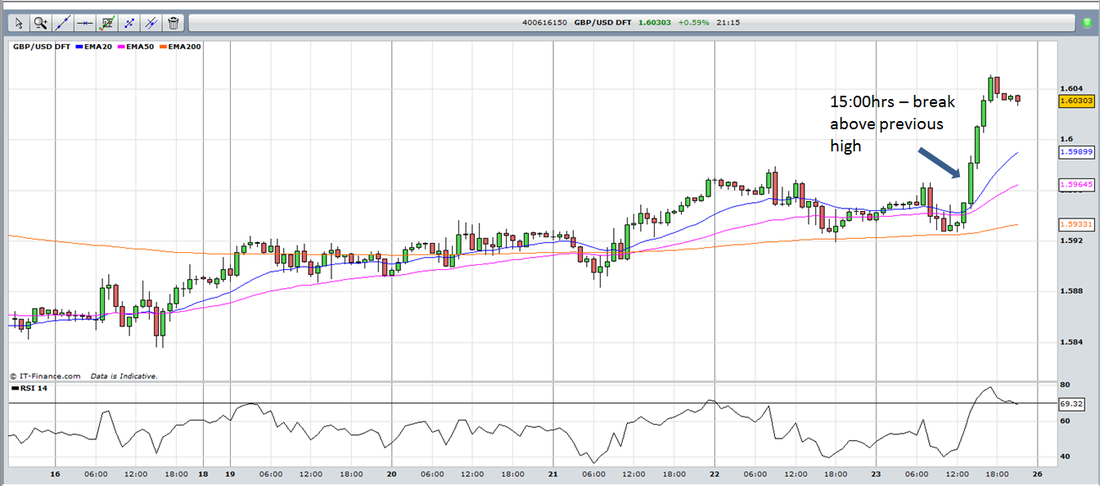
The two charts below show both the Euro and Sterling putting in large gains against the Dollar shortly after lunch yesterday.
Picture
Picture
It was no surprise then that, shortly afterwards, the gold price shot up to take out the resistance levels at $1738 (the upper limit of the trading range) and $1742 (the 50-day Moving Average).

As gold breached these key areas of resistance, short stop losses and long buy orders would have been triggered, adding even more momentum to the upwards move.

Early next week, the focus will be back on Greece as Eurozone leaders attempt to arrive at new debt targets for the stricken country before agreeing to release the next wave of bailout funds.  An agreement is likely to underpin the Euro and so add more of a boost to gold prices.

Later in the week eyes will turn to speeches by Fed members where traders will attempt to predict the likely outcomes of the next FOMC meeting on December 11th & 12th.  This will be the first meeting since the US Presidential elections and investors will be watching the speeches next week to try to gain some insight into the Fed's plans as the "Operation Twist" program comes to an end in December.

We foresee a short period of consolidation for gold next week before a continuation of the rise towards $1800.  There is resistance at $1785 and then again at the previous 2012 high of $1796.

On the downside, there is solid support $1720-$1715 and again at $1700.

0 Comments

Gold Market Update - 23rd Nov

23/11/2012

0 Comments

 
Gold moved in a narrow $4 range yesterday, as the "flat topped triangle" chart pattern draws towards a conclusion.

We expect this pattern to resolve with a strong upside breakout, as is usually the case, though the light holiday trading should continue to cap prices this week.  Options expiry on Tuesday may see some volatility return to the market.

Key resistance is at 1738 and with the 50 DMA just above at 1743, it is not surprising that the market has stalled in this area.

For our subscribers at www.goldtradingexperts.com, today's video looks at the triangle chart pattern in more detail and previous examples of the same chart pattern.
0 Comments

Gold Market Update - 22nd Nov

22/11/2012

0 Comments

 
In a quiet, pre-Thanksgiving day of trading yesterday, gold bounced around between 1720 and 1730, consolidating the rally from 1673 to 1738.

The key level remains 1738, though with options expiry on Tuesday and a large number of calls between 1750 and 1800, we expect the quiet, sideways trading to continue until Tuesday at least.

Options expiry day is often unpredictable and volatile as traders square positions, so we expect to remain on the sidelines until after Tuesday, barring any large moves in the meantime.

For our subscribers at www.goldtradingexperts.com, today's video discusses options expiry in more detail and our strategy for our next trade.
0 Comments

Gold Market Update - 21st Nov

21/11/2012

0 Comments

 
Gold found stiff resistance at the 1730 area again and could not find any follow through strength and break through yesterday.

The perceived winding down of the Gaza conflict saw oil prices fall dramatically which put pressure on gold and, once 1730 was breached the market fell quickly back to the 23.6% retracement level before finding support there.

However the market remains vulnerable to further weakness after failing again at the 1730-1738 area.

The key level remains 1738 - if gold can break through here, then 1800 comes firmly back into sight.  There is solid support at 1700-1705, any break of this area would see a quick return to 1673 and a retest of the lows.

For our subscribers at www.goldtradingexperts.com, today's video looks at yesterday's price action in more detail and our strategy for our next trade.
0 Comments
<<Previous

    Old Posts

    August 2021
    July 2021
    June 2021
    May 2021
    March 2021
    February 2021
    January 2021
    December 2020
    November 2020
    March 2019
    January 2019
    December 2018
    October 2018
    September 2018
    August 2018
    July 2018
    June 2018
    May 2018
    March 2018
    February 2018
    July 2017
    June 2017
    May 2017
    April 2017
    March 2017
    February 2017
    January 2017
    December 2016
    July 2016
    March 2016
    December 2015
    November 2015
    October 2015
    September 2015
    August 2015
    July 2015
    June 2015
    May 2015
    April 2015
    March 2015
    February 2015
    January 2015
    December 2014
    November 2014
    October 2014
    September 2014
    August 2014
    July 2014
    June 2014
    May 2014
    April 2014
    March 2014
    February 2014
    January 2014
    December 2013
    November 2013
    October 2013
    September 2013
    August 2013
    July 2013
    June 2013
    May 2013
    April 2013
    March 2013
    February 2013
    January 2013
    December 2012
    November 2012
    October 2012
    September 2012
    August 2012
    July 2012
    June 2012
    May 2012
    April 2012
    March 2012
    February 2012
    January 2012
    December 2011
    November 2011
    October 2011

UK Gold Trading Experts (UKGTE) is a trading name of Drupac Limited, a company registered in England and Wales (company number 09167819) whose registered office is 1 St. Paul's Square, Birmingham, B3 1QU.