UK Gold Trading Experts
  • Home
  • Trade Like a Pro
  • Gold Blog
  • Subscriber Resources
  • Legal Stuff
    • User Agreement
  • Contact Us

Gold Market Update - 31st Mar

31/3/2014

0 Comments

 
Trade Gold Online Trader
Gold finally found support at 1285 on Friday after sustained selling all week, with the 50% retracement and trend line providing enough of a signal for buyers to step in and form a bullish "hammer" candlestick on the daily chart.  There is a clear reverse "head and shoulders" pattern evident on the 4 hour chart that suggests higher prices in the near term.

Gold is currently trading right on the 200 DMA - the bulls will be watching this line closely, a decisive break of which would put the bullish case in doubt.  We expect the 200 DMA to provide support and the price of gold to move back above 1300 this week.

Equities remain strong and near all time highs, though as we noted last week there is a clear line of resistance around 1880 on the S&P 500.  Oil is now well above $100 a barrel again after last month's sharp dip and the dollar is holding strong above 80 - these are all negative factors for gold, though we are in a historically strong seasonal period for the yellow metal.

Support can be found at 1285-1290, 1280, 1275, 1250-1255, 1237-1240, 1220-1225, 1210, 1200 and 1180.  A break of 1180 would have serious bearish implications for gold and suggest a decline to 1000-1050 in the short term, though this now looks unlikely unless we break below 1250.

Resistance can be found at 1298-1300, 1307, 1318-1322, 1330-1332, 1340-1342, 1352-1354, 1392-1395, 1400, 1420 and 1435.  The impulsive breakout above the down trend line on the weekly chart suggests an end to the intermediate term down trend and that a significant rally is now developing.

Today's video for subscribers looks at the recent trading in more detail and our thoughts on gold's trading this week.

0 Comments

Gold Market Update - 28th Mar

28/3/2014

0 Comments

 
Trade Gold Online Trader
The sharp sell off in gold continued yesterday, with the price dropping as low as 1289 before finding support at the major trendline and 50% retracement of the 2014 rally.

The ABC Wave 2 correction appears to be almost over, with gold selling off over $100 in the past two weeks - we would not be surpised to see the rally resume from here.

The dollar remains well supported above 80, oil is powering higher again after a sharp correction and equities remain near all time highs.  There are signs of a top forming in the S&P 500 however, with the 1880 level providing strong resistance and upward momentum waning.

A significant correction in equities will likely see the dollar fall and gold rise sharply, we suspect a further strong rally in gold will not be forthcoming until this occurs.

Support can be found at 1289-1291, 1280, 1275, 1250-1255, 1237-1240, 1220-1225, 1210, 1200 and 1180.  A break of 1180 would have serious bearish implications for gold and suggest a decline to 1000-1050 in the short term, though this now
looks unlikely.

Resistance can be found at 1298-1300, 1307, 1318-1322, 1330-1332, 1340-1342, 1352-1354, 1392-1395, 1400, 1420 and 1435.  The breakout above 1300 suggests an end to the intermediate term down trend and that a significant rally is now developing.

Today's video for subscribers looks at the recent trading action in more detail and our throughts on gold trading for next week.

0 Comments

Gold Market Update - 27th Mar

27/3/2014

0 Comments

 
Trade Gold Online Trader
Gold dipped briefly below 1300 yesterday, breaking through the 50 DMA and 38.2% Fibonnaci retracement level on the daily chart before finding some support and closing at 1306.  This morning, gold is under pressure again and trading well below 1300, with the 50% retracement level at 1287 the next potential area of support.

The sharp correction suggests that gold is retracing in a Wave 2 phase with Wave 1 taking the price from the 31 December low at 1182 to 1392, a 210 point move.

Equities remain near all time highs and the dollar rally continues, with the price holding well above 80 and oil trading at over $100 a barrel.

Support can be found at 1295-1300, 1280, 1275, 1250-1255, 1237-1240, 1220-1225, 1210, 1200 and 1180.  A break of 1180 would have serious bearish implications for gold and suggest a decline to 1000-1050 in the short term, though this now looks unlikely.

Resistance can be found at 1307, 1318-1322, 1330-1332, 1340-1342, 1352-1354, 1392-1395, 1400, 1420 and 1435.  The breakout above 1300 suggests an end to the intermediate term down trend and that a significant rally is now developing.

Today's video for subscribers looks at the recent trading in more detail and our targets for this Wave 2 correction.

0 Comments

Gold Market Update - 26th Mar

26/3/2014

0 Comments

 
Trade Gold Online Trader
Gold made a further low at 1305 yesterday, bouncing off support at the 50 DMA.  The rebound has been weak and unenthusiatic, suggesting more downside before we get a final bottom.

We do expect a bottom this week and a resumption of the rally once this Wave 2 correction has run its course.

The dollar remains well supported above 80, oil is trading back above $100 a barrel and equities are pushing back towards all time highs.  This combination is pressuring gold (the usual positive correlation between gold and oil being reversed this year), though we consider this to be a healthy correction within a new bull market for gold.

Support can be found at 1307, 1295-1300, 1280, 1275, 1250-1255, 1237-1240, 1220-1225, 1210, 1200 and 1180.  A break of 1180 would have serious bearish implications for gold and suggest a decline to 1000-1050 in the short term, though this now looks unlikely.

Resistance can be found at 1318-1322, 1330-1332, 1340-1342, 1352-1354, 1392-1395, 1400, 1420 and 1435.  The breakout above 1300 suggests an end to the intermediate term down trend and that a significant rally is now developing.

Today's video for subscribers looks at the recent trading in more detail and our targets for this Wave 2 correction.

0 Comments

Gold Market Update - 25th Mar

25/3/2014

0 Comments

 
Trade Gold Online Trader
Gold tumbled yeasterday, breaching support around 1320 to drop as low as 1308 before finding some support.  This morning, gold is trading near the lows and close to the 50 DMA after a tepid bounce off support.

It is clear that gold is correcting more deeply than we originally thought and the Wave 1 rally looks to have ended at 1391.  The dollar has rebounded sharply from lows near 79 and oil and equities are also recovering well after a short sharp sell off.

Gold has retraced 50% of it's recent rally from 1238, however we expect further declines as an ABC correction unfolds.

Support can be found at 1307, 1295-1300, 1280, 1275, 1250-1255, 1237-1240, 1220-1225, 1210, 1200 and 1180.  A break of 1180 would have serious bearish implications for gold and suggest a decline to 1000-1050 in the short term, though this now looks unlikely.

Resistance can be found at 1318-1322, 1330-1332, 1340-1342, 1352-1354, 1392-1395, 1400, 1420 and 1435.  The breakout above 1300 suggests an end to the intermediate term down trend and that a significant rally is now developing.

Our video for subscribers looks at some potential targets for this correction and our strategy for our next trade.

0 Comments

Gold Market Update - 21st Mar

21/3/2014

0 Comments

 
Trade Gold Online Trader
Gold fell further yesterday, finding support around 1320 and moving higher after a bullish RSI divergence on the 4 hour chart at the lows.  The strong finish produced a bullish "hammer" candlestick on the daily chart that suggests a recovery rally of some order is underway.

We will be watching how the market reacts at key points to assess the strength of the rally and whether we can expect it to surpass last week's highs or make a lower high.

Our initial observations suggest a move up towards 1360 before finding resistance, though a break of that congestion area should see 1380 and a potential new high.

 The dollar remains above 80 after a powerful rally on Thursday, though the general weakness remains and we would not be surprised to see some profit taking at these levels and a return towards 79.

Support can be found at 1335, 1330-1332, 1322, 1312-1315, 1307, 1295-1300 and 1280.

Resistance can be found at 1340, 1350, 1360, 1370-1373, 1380, 1388-1391, 1395-1400, 1420 and 1435.  The breakout above 1300 suggests an end to the intermediate term down trend and that a  significant rally is now developing.

Today's video for subscribers looks at the recent trading in more detail and the key points to look out for in this rally.

0 Comments

Gold Market Update - 20th Mar

20/3/2014

0 Comments

 
Picture
A surge in the dollar yesterday saw gold tumble below the 20 DMA, with the price falling $30 before finding support around 1330.  Gold has fallen sharply since touching the 65 week MA, a long term resistance line, and is now over $60 down from that peak.

With the situation in Ukraine simmering down for now, the dollar powering higher and equities and oil finding renewed buying, gold is under pressure, with the mixed messages from the FOMC meeting yesterday adding to gold's worries.

It appears that the strong rally from the 31 December lows is over for now, though we suspect this is the first leg of a new upleg and as such, when this correction is completed we will see gold move higher again.  The sharp decline in recent days suggests to us that a retrace back towards 1380 is likely in coming days.

Support can be found at 1330-1332, 1322, 1312-1315, 1307, 1295-1300 and 1280.

Resistance  can be found at 1340, 1350, 1360, 1370-1373, 1380, 1388-1391, 1395-1400, 1420 and 1435.  The breakout above 1300 suggests an end to the intermediate term down trend and that a  significant rally is now developing.

Today's video for subscribers looks at the recent trading in more detail and our thoughts for what happens next in gold.

0 Comments

Gold Market Update - 19th Mar

19/3/2014

0 Comments

 
Trade Godl Online Trader
Gold continued to correct yesterday after reaching our rally target at 1391, falling as low as 1350 before finding support.

This morning, gold remains under pressure and is currently trading around 1347, with the FOMC statement released tonight at 7pm expected to shed further light on the Fed's plans for tapering QE and interest rate guidance.

With the UK Budget today, we may see quiet trading throughout the afternoon before the FOMC meeting takes centre stage - any increase in the rate of tapering could see gold under pressure and the dollar rally, however a pause or reassessment of the QE tapering programme would be positive for gold and see further dollar selling.

Equities and oil surged higher yesterday, putting further pressure on gold, though the weak dollar is limiting losses in the yellow metal.

Support can be found at 1340, 1330-1332, 1322, 1312-1315, 1307, 1295-1300 and 1280.

Resistance  can be found at 1360, 1370-1373, 1380, 1388-1391, 1395-1400, 1420 and 1435.  The breakout above 1300 suggests an end to the intermediate term down trend and that a  significant rally is now developing.

Today's video for subscribers looks at the recent trading in more detail and our thoughts on the current decline.

0 Comments

Gold Market Update - 18th Mar

18/3/2014

0 Comments

 
Trade Gold Online Trader
Gold found resistance at the 65 week moving average yesterday, exactly where we advised our subscribers that gold would reverse.  After touching 1391, gold fell over $30 as profit taking came in, with the price falling back as far as the 200 hour moving average at 1358 this morning.

We expect this level to provide solid support for gold and a move back up to retest the weekly highs is, in our view, likely.  However, the lack of economic news this week could see a period of consolidation below the highs.

The dollar remains weak, oil has tumbled following the simmering down of tensions in Ukraine and equities have not sold off significantly as of yet.

Support can be found at 1358-1360, 1354, 1350, 1340, 1330-1332, 1322, 1312-1315, 1307, 1295-1300 and 1280.

Resistance  can be found at 1370-1373, 1380, 1388-1391, 1395-1400, 1420 and 1435.  The breakout above 1300 suggests an end to the intermediate term down trend and that a  significant rally is now developing.

Today's video for subscribers looks at the recent trading in more detail and some possible Elliot Wave scenarios.

0 Comments

Can Gold and Interest Rates Move Higher at the Same Time?

17/3/2014

0 Comments

 
Based on the March 2014 Market Overview report

Can the gold price be fundamentally related to some other economic variables? Can we use those variables successfully in trying to predict the future price of gold? Is gold highly correlated with any of those variables?

Last year a very insightful and interesting working paper was published in the webpages of the National Bureau of Economic Research by Claude Erb and Campbell Harvey. The paper is mostly about gold being perceived as either a safe haven or an inflation hedge. After a while it sparked various discussions about gold not being what it is thought of. And rightly so. As we have already mentioned many times in the Market Overviews, gold is not historically an inflation hedge device which will protect you against possible inflation. Of course the special case for the gold price could be a hyperinflationary scenario.

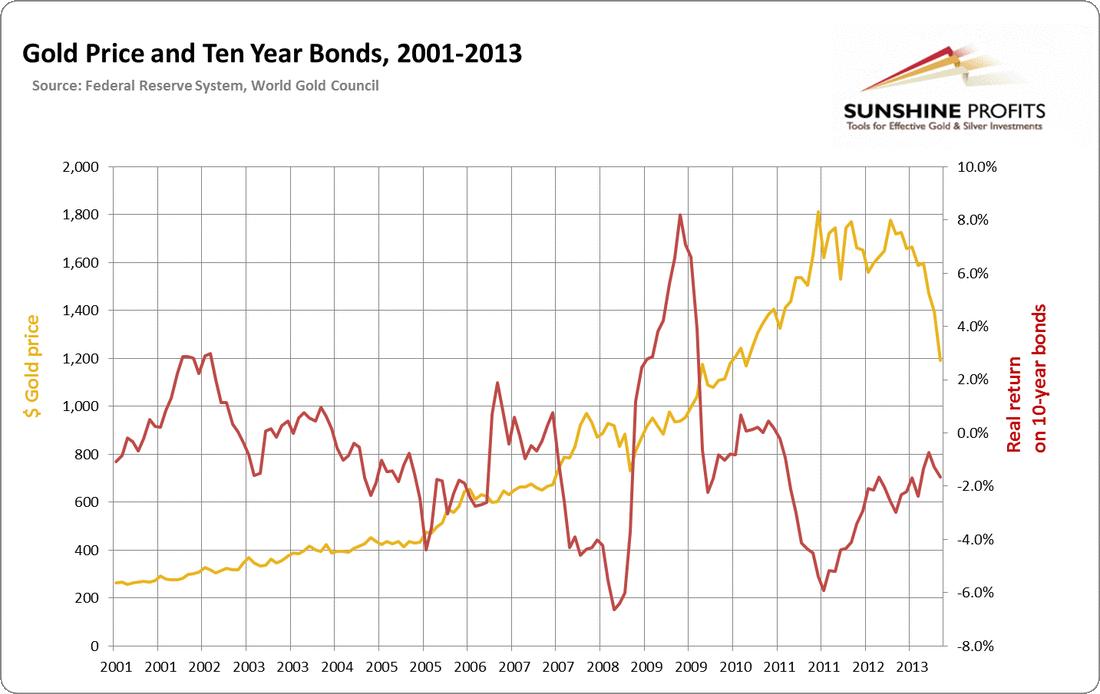
In the same paper Erb and Harvey have found a very interesting correlation in the gold market that lies between the gold price and the interest rates. If real interest rates rise, then gold falls. If real interest rates fall, gold gains. In itself this relationship is nothing new for gold analysts. This observation about gold related to the interest rates has been floating around for some time. It is perfectly understandable since there are good explanations for the phenomenon, and (as opposed to the inflation-hedge hypothesis) this one actually has some confirmation in the data.

Erb and Harvey did a comparison of the real price of gold to TIPS – Treasury Inflation Protected Security – to ten-year government bonds, which are adjusted by the inflation rate. The correlation seems to be very high, especially in the realm of economic data – 0.82! This is pretty high if we compare it with numerous other correlations done in various fields of study.

It is no surprise then that the previously existing theory has been boosted again. Despite the fact that the authors of the paper were very careful and reserved in drawing any serious conclusions from this observation, some of those inspired by the research already attempted to use those observations to predict future gold movements. We could read predictions that if you expect gold to come closer to 2 thousand dollars per ounce, then we should see interest rates first coming lower under the one percent level. At least that’s what the numbers are telling us, and the numbers could not possibly lie to us, could they? Perhaps I forgot to mention that all those predictions have something smuggled in a very smooth and elegant way, which comes down to “provided that history is good guidance…”

Is it in this case?
Picture
Actually an observed correlation relates only to the most recent 17 years. That is not that much when it comes to determining long-term relationships. And it can be explained in a different manner. As we emphasized, gold should be treated as a specific currency in the financial market. It is a dollar alternative. Therefore anything that happens to the dollar economy, any negative sign of its weakness will favor gold, and boost its value. Therein is the reason why low real interest rates were so often associated with gold’s increases in value. When the American economy is weak, interest rates are often lowered because of the responsive monetary policy of the central bank. Hence there may have been a common denominator for low interest rates and high prices of gold: bad times for the dollar economy. With distrust in dollar assets, investors get more interest in the shiny asset, and bureaucrats are ready to print money. Those two things perfectly coincide.

Actually any sensible story about investing in gold could be translated into the comprehendible story within the margin.

How is that relevant for the current gold investor? As simple as this: even if the interest rates are raised, it does not mean that gold’s bull market has to be over. Even if the returns on government bonds go up significantly, the gold market need not be decimated because of it. And the other way around. Just because interest rates are at low levels and will stay at significantly low levels (as Yellen tries to assure us), it does not mean that gold is the safest investment on a short-term basis (as recent experience in the market a few months ago has confirmed). Every such change has to be interpreted in the context of the economic situation. We also have to remember that interest rates are a very complex phenomenon.

It is not hard to imagine a scenario in which long-term interest rates are going up, and gold is still booming. In fact it is quite easy. Can there be the case of more distrust in the dollar system and increasing returns on government bonds? Yes, there can be such a scenario. For example, it can simply happen when investors also start distrusting US Treasuries, and not only other (mostly commercial) dollar assets (which could happen if inflation was very high, and in the end a huge outflow of capital from United States would result). Plus, in the previous bull market (70’s), interest rates simply followed gold higher.

All in all, the main reason behind gold’s bull market is the failing dollar system. The Fed’s interest rate policy is a way to deal with this epic problem and gold’s performance is mainly the consequence of the latter, not the former. It therefore seems that the interest rate environment will continue to support higher gold prices, but one should keep in mind that the gold-interest-rates link is not carved in stone.

The above is an excerpt from our latest Market Overview report. We invite you to sign up for the full version today.

Thank you.

Matt Machaj, PhD

Sunshine Profits‘ Market Overview Editor

Gold Market Overview at SunshineProfits.com

Disclaimer

All essays, research and information found above represent analyses and opinions of Matt Machaj, PhD and Sunshine Profits' associates only. As such, it may prove wrong and be a subject to change without notice. Opinions and analyses were based on data available to authors of respective essays at the time of writing. Although the information provided above is based on careful research and sources that are believed to be accurate, Matt Machaj, PhD and his associates do not guarantee the accuracy or thoroughness of the data or information reported. The opinions published above are neither an offer nor a recommendation to purchase or sell any securities. Matt Machaj, PhD is not a Registered Securities Advisor. By reading Matt Machaj’s, PhD reports you fully agree that he will not be held responsible or liable for any decisions you make regarding any information provided in these reports. Investing, trading and speculation in any financial markets may involve high risk of loss. Matt Machaj, PhD, Sunshine Profits' employees and affiliates as well as members of their families may have a short or long position in any securities, including those mentioned in any of the reports or essays, and may make additional purchases and/or sales of those securities without notice.

0 Comments
<<Previous

    Old Posts

    August 2021
    July 2021
    June 2021
    May 2021
    March 2021
    February 2021
    January 2021
    December 2020
    November 2020
    March 2019
    January 2019
    December 2018
    October 2018
    September 2018
    August 2018
    July 2018
    June 2018
    May 2018
    March 2018
    February 2018
    July 2017
    June 2017
    May 2017
    April 2017
    March 2017
    February 2017
    January 2017
    December 2016
    July 2016
    March 2016
    December 2015
    November 2015
    October 2015
    September 2015
    August 2015
    July 2015
    June 2015
    May 2015
    April 2015
    March 2015
    February 2015
    January 2015
    December 2014
    November 2014
    October 2014
    September 2014
    August 2014
    July 2014
    June 2014
    May 2014
    April 2014
    March 2014
    February 2014
    January 2014
    December 2013
    November 2013
    October 2013
    September 2013
    August 2013
    July 2013
    June 2013
    May 2013
    April 2013
    March 2013
    February 2013
    January 2013
    December 2012
    November 2012
    October 2012
    September 2012
    August 2012
    July 2012
    June 2012
    May 2012
    April 2012
    March 2012
    February 2012
    January 2012
    December 2011
    November 2011
    October 2011

UK Gold Trading Experts (UKGTE) is a trading name of Drupac Limited, a company registered in England and Wales (company number 09167819) whose registered office is 1 St. Paul's Square, Birmingham, B3 1QU.