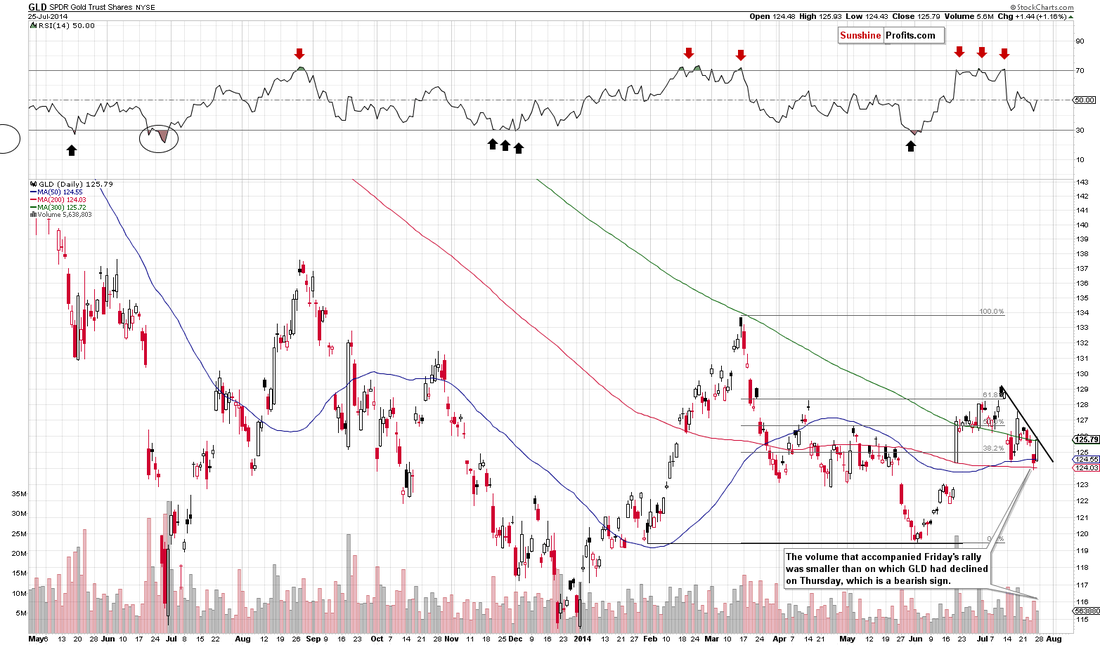
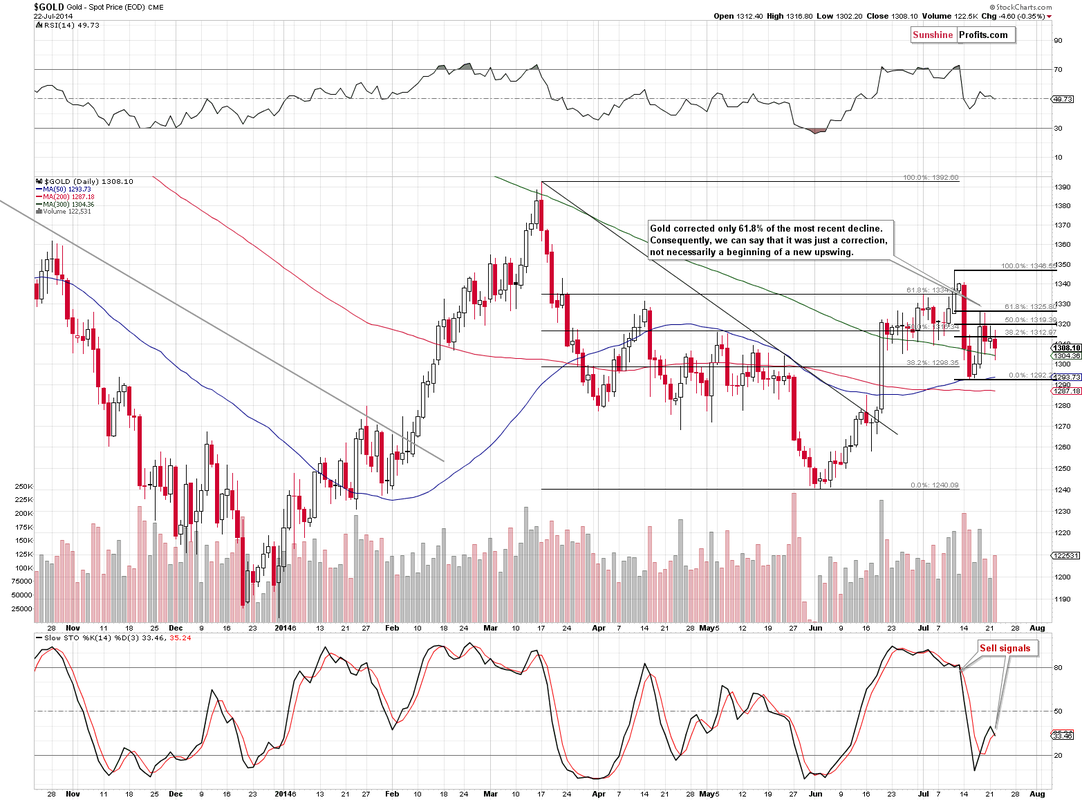
Gold bounced around in the range defined by the 20 DMA at the top and the 50 DMA at the bottom yesterday, as the "summer doldrums" type trading continues. This is typified by choppy sideways trading with a downwards bias and narrow trading ranges and is usually seen in July/August as the markets wind down for the holiday season.
The market is well supported around 1287-1292 on the down side - a break of this level will see an escalation in the decline with 1274 our initial target.
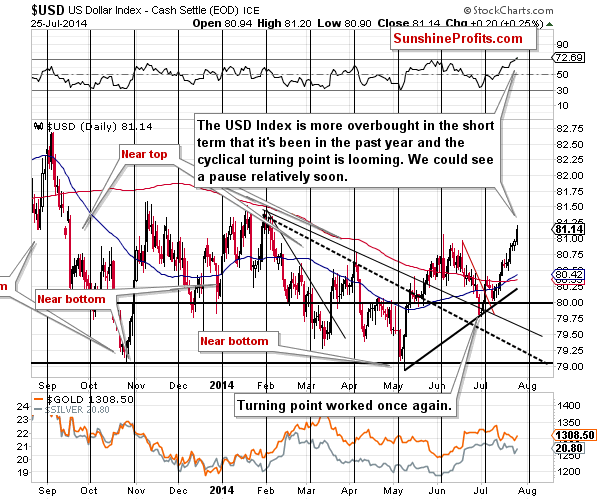
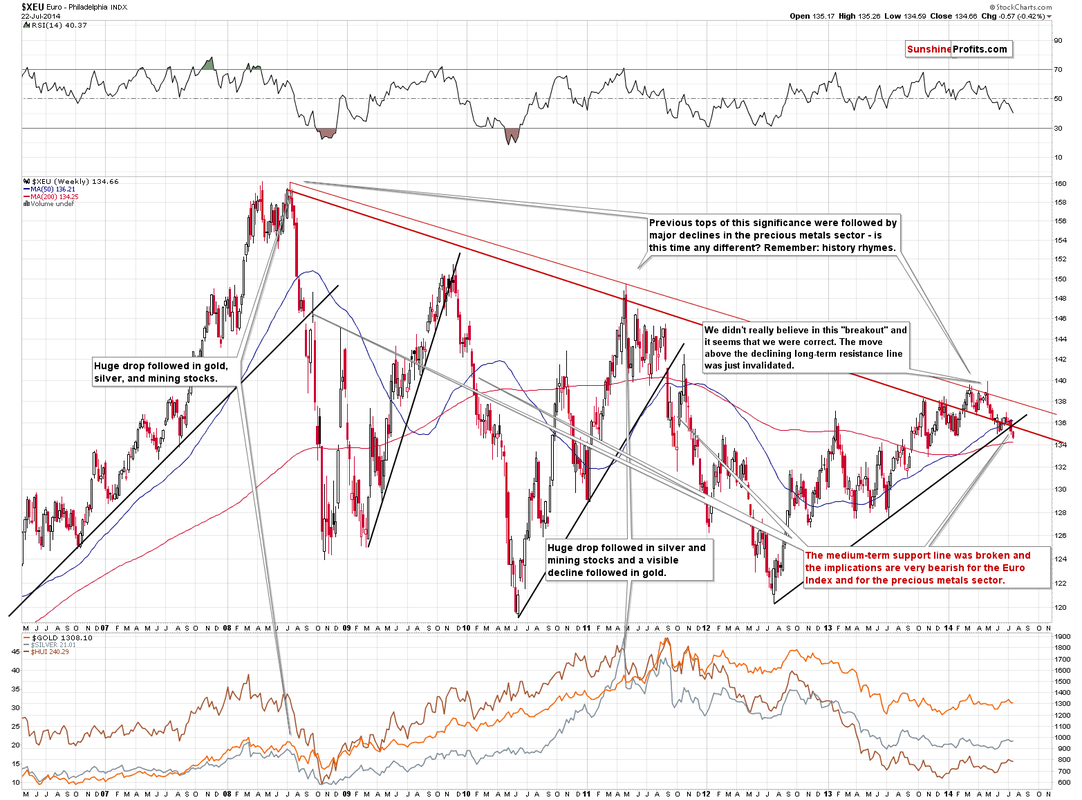
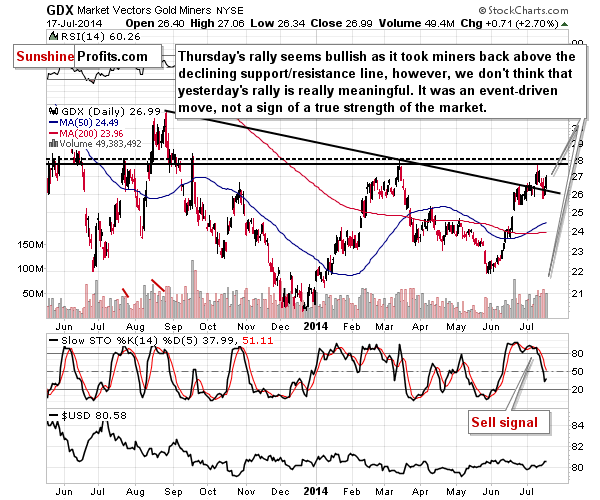
The dollar strength continues, with the rally taking the dollar well above 81, this is bearish for gold and is a major factor in the recent price weakness. Equities near to all time highs add to the overall bearish picture for gold.
Today may see quiet trading leading up to the FOMC interest rate decision in the US at 7pm UK time - any hint of an imminent rate rise will see gold under more pressure and the dollar rally extend further.
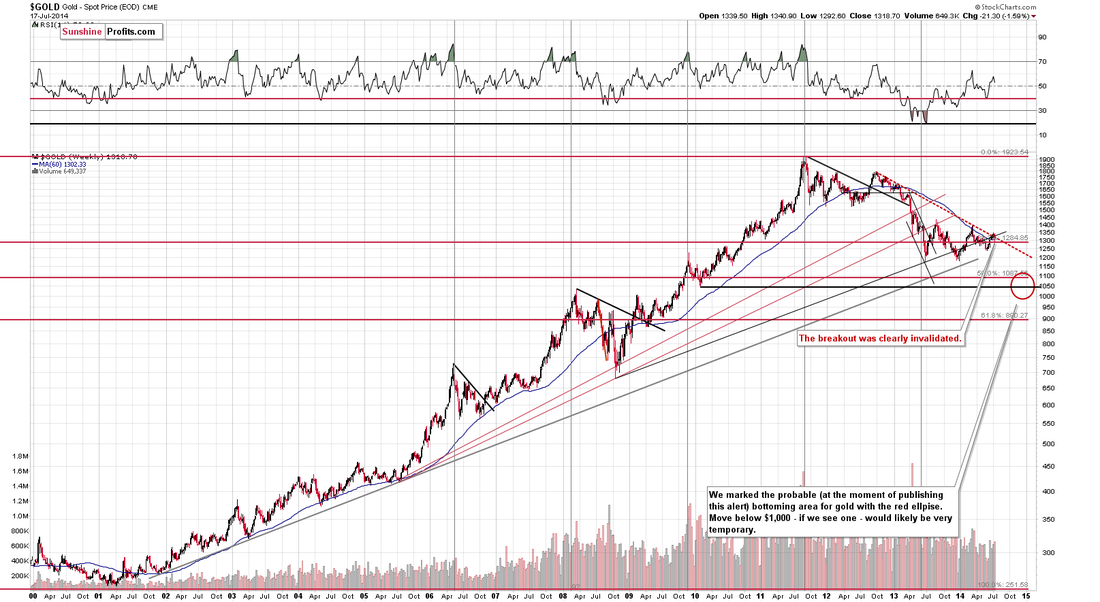
Support can be found at 1299-1301, 1292, 1285-1287, 1263, 1257-1260, 1250-1252, 1237-1240, 1220-1225, 1210, 1200 and 1180. A break of 1180 would have serious bearish implications for gold and suggest a decline to 1000-1050 in the short term - a failure to break the 65 week MA would make this much more likely.
Resistance can be found at 1310, 1318-1322, 1325-1326, 1333-1335, 1340-1342, 1352-1354, 1392-1395, 1400, 1420 and 1435. We appear to be witnessing a second failure to break through the key 65 week MA - this would suggest that the intermediate down trend is intact and a retest of 1240 and possibly 1180 is likely.
Today's video for subscribers looks at the rcent trading in more detail and our strategy for our next trade.
The market is well supported around 1287-1292 on the down side - a break of this level will see an escalation in the decline with 1274 our initial target.
The dollar strength continues, with the rally taking the dollar well above 81, this is bearish for gold and is a major factor in the recent price weakness. Equities near to all time highs add to the overall bearish picture for gold.
Today may see quiet trading leading up to the FOMC interest rate decision in the US at 7pm UK time - any hint of an imminent rate rise will see gold under more pressure and the dollar rally extend further.
Support can be found at 1299-1301, 1292, 1285-1287, 1263, 1257-1260, 1250-1252, 1237-1240, 1220-1225, 1210, 1200 and 1180. A break of 1180 would have serious bearish implications for gold and suggest a decline to 1000-1050 in the short term - a failure to break the 65 week MA would make this much more likely.
Resistance can be found at 1310, 1318-1322, 1325-1326, 1333-1335, 1340-1342, 1352-1354, 1392-1395, 1400, 1420 and 1435. We appear to be witnessing a second failure to break through the key 65 week MA - this would suggest that the intermediate down trend is intact and a retest of 1240 and possibly 1180 is likely.
Today's video for subscribers looks at the rcent trading in more detail and our strategy for our next trade.