UK Gold Trading Experts
  • Home
  • Trade Like a Pro
  • Gold Blog
  • Subscriber Resources
  • Legal Stuff
    • User Agreement
  • Contact Us

3 Wins in a Row - 5th Mar Trading Update

5/3/2018

1 Comment

 
Good afternoon Subscribers,

That’s three wins in a row over the past week or so, marking a really strong finish to February and start to March.  Let’s take a quick look at today’s trade…

We entered this trade in the early hours – 3:12am on the GKFX clock, at 1326 – with our stop at 1329.6 and a target of 1319. 
​
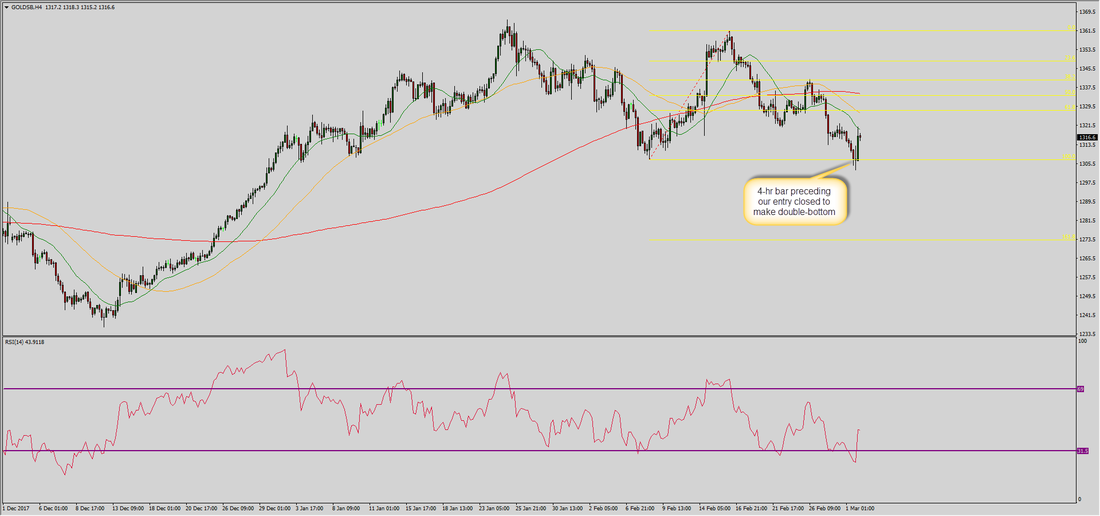
The chart below is the daily – we’ve got the 20-day Moving Average at 1329 and the 50-day at 1327, converging to form an area of resistance.  This put our automated trading algorithm on alert for a reversal set up.
Picture
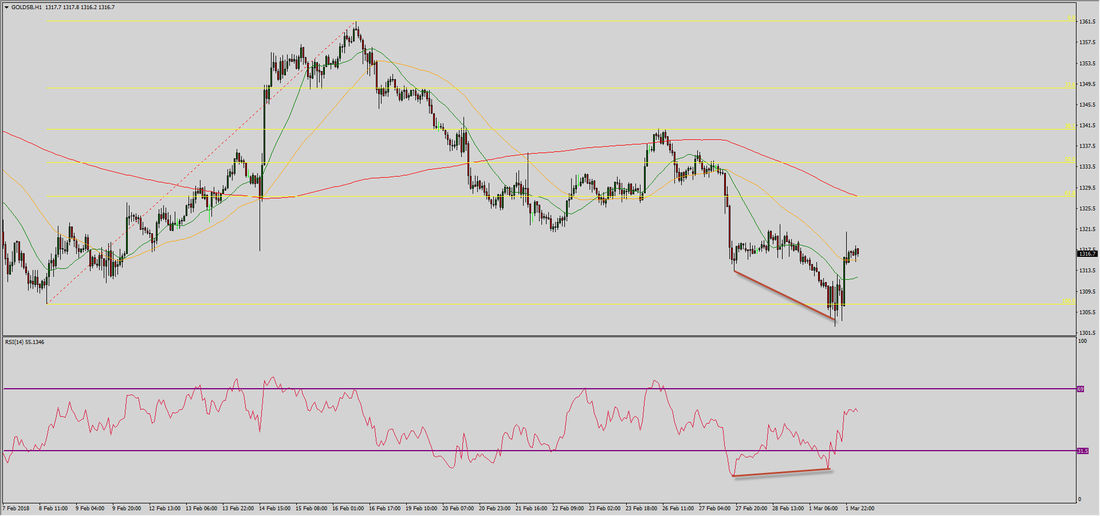
​On the hourly chart below we’ve added the Fibonacci Retracement from the 1341 high to the 1302 low.  Notice that the 61.8 level is 1326.2 – add that to the area of resistance we mention above, and it would seem like a short at 1326 with a stop just above 1329 would be a good trade.
Picture
Also notice on the hourly chart above that our target of 13.19 sits just above 38.2 support level of 1317.  On the basis that the 50% level gives way, price should reach 1317.
​
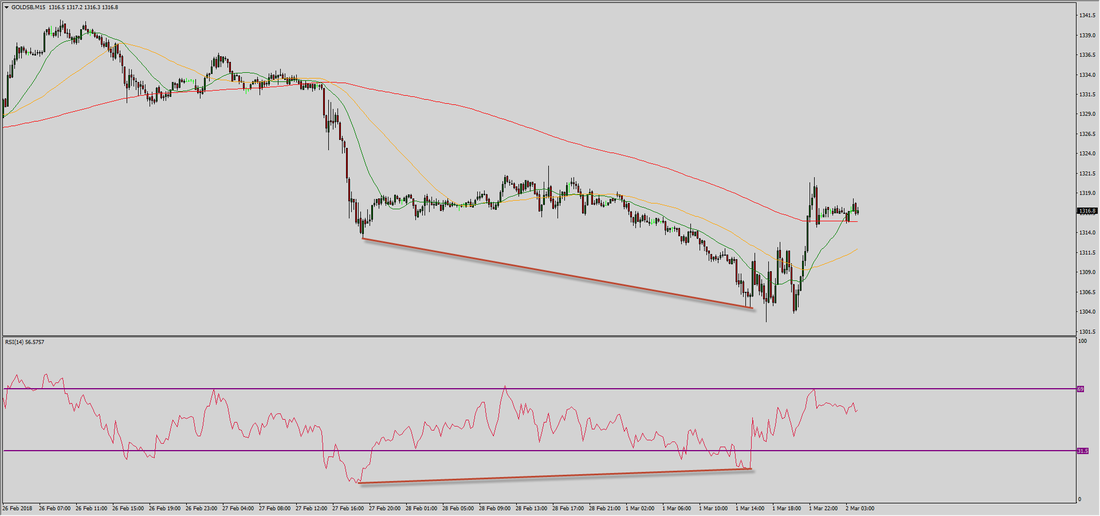
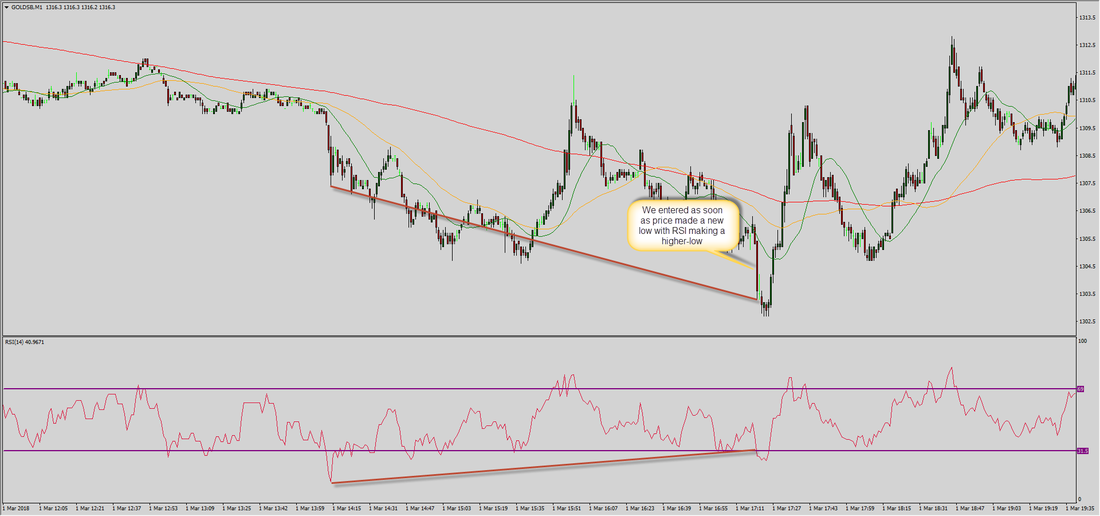
The next chart we have below is the 15m – notice here how the 3am bar makes a higher-high whilst he RSI high is lower than earlier highs, giving us bearish RSI divergence.
Picture
​Now, of course this bar is in formation between 3am – 3:15am and so the divergence hadn’t formed when we pulled the trigger at 3:12am – had it?
Picture
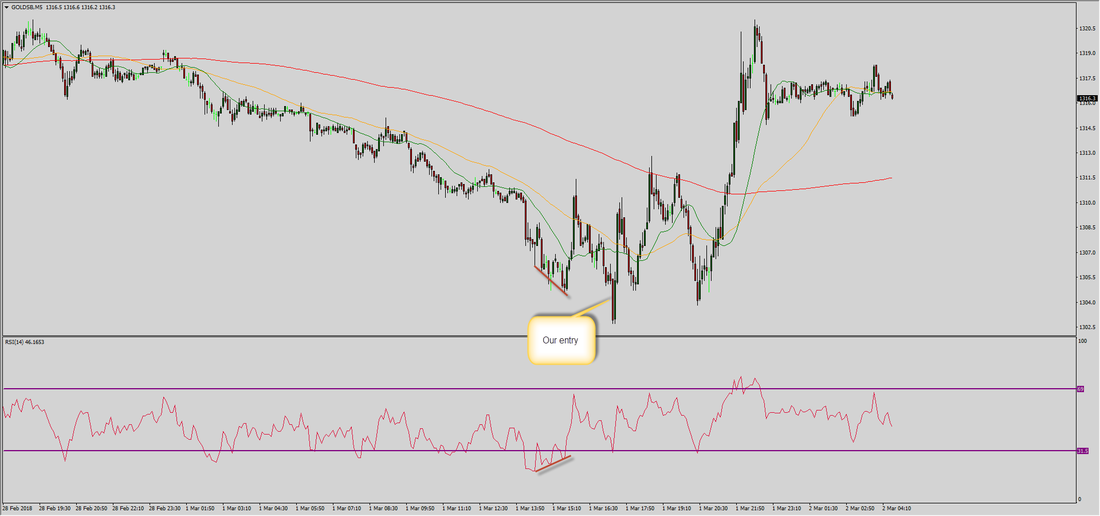
The chart above shows the 5m chart – notice how we’ve got the same RSI divergence setting up.  On this timeframe it’s the 3:05am candle which climbs up to make the new high and therefore ensuring that, no matter what, there will be RSI divergence on the 15m also – giving us a great place to enter.

This one took a little while to move in our direction – but as you can see from the charts above, price rolled over as expected and moved towards our target.  We jumped out a little earlier than planned as the delay in price falling has led to moving averages on the 15m and hourly chart moving towards price to near our target.  We felt this would (and actually it has) build support around 1320 which may lead to a bounce.  We’d rather bag the points than hold out in hope where we’re this close.

We’re currently flat and waiting for our next set up.
​
Thanks as always for following us.
1 Comment

Gold Trading Update 1st Mar 2018 - Another Winning Trade!

2/3/2018

0 Comments

 
Good morning Subscribers,

Another winner yesterday – a quick “in and out” for 50 points.  Let’s take a quick step through…this case provides a great example of how we use information from multiple timeframes to set up a winning trade, in this instance with signals from the 4-hour chart all the way down to an expertly timed entry from the 1-minute chart.

The first chart below is the 4-hour.  Our trade was triggered at 17:21 GKFX time (2hrs ahead of the UK) – notice on this chart where the 13:00 4hr bar closed…right on the line of the 100% fib retracement level, effectively making a double-bottom with the low on 8th Feb.  Because this is on the 4-hour, it will weigh heavily on the lower timeframes.  Also notice RSI is oversold.  So we’re now expecting some sort of bounce.  It’s also worth noting the proximity to the 1300 level…round numbers such as these tend to form natural support & resistance levels.  Again, another clue that a bounce is due.
Picture
​The next chart is the hourly.  In the lead up to our entry there is very strong bullish RSI divergence, with some choppy price action in the 3 hours leading up to our trade.
Picture
​Similar again on the 15m chart below – bullish RSI divergence and then choppy price action near a strong support point from a higher timeframe (remember what we saw on the 4H) is a strong indicator that we’re going to see the reversal soon.
Picture
So far, our “clues” have been a clear area of support encountered on the 4H (double-bottom + 1300 natural support level), backed up by strong bullish RSI divergence on the 1H and 15m charts.  In these scenarios where there are multiple indicators from higher timeframes weighing down we tend to look to the very short timeframe charts such as the 5m or even the 1m to get our trigger...which was the case here.

The next two charts are the 5m and 1m
​
On the 5m below, notice how prior to our entry there is very short-term bullish RSI divergence.  Price rallies, but it’s not very strong and soon collapses back to around 1305.  This has lifted RSI higher and so sets up the potential for a continuation of that divergence if price makes a lower low.  We were waiting for that to form to enter.
Picture
​On the 1m chart below you can see the same pattern – bullish RSI divergence from around 14:15 followed by a short rally.  We’ve marked our entry on the close of the 17:20 candle…as soon as price broke below the previous lows but posted an RSI low higher than previous lows we knew that it would lead to a continuation of the RSI divergence on the higher timeframe and so was a great place to take an entry a little bit ahead of anyone else.
Picture
Another solid win and a great start to March after a profitable February.
​
Thank you, as always, for following us! We’re currently flat, waiting for our next set up.
0 Comments

    Old Posts

    August 2021
    July 2021
    June 2021
    May 2021
    March 2021
    February 2021
    January 2021
    December 2020
    November 2020
    March 2019
    January 2019
    December 2018
    October 2018
    September 2018
    August 2018
    July 2018
    June 2018
    May 2018
    March 2018
    February 2018
    July 2017
    June 2017
    May 2017
    April 2017
    March 2017
    February 2017
    January 2017
    December 2016
    July 2016
    March 2016
    December 2015
    November 2015
    October 2015
    September 2015
    August 2015
    July 2015
    June 2015
    May 2015
    April 2015
    March 2015
    February 2015
    January 2015
    December 2014
    November 2014
    October 2014
    September 2014
    August 2014
    July 2014
    June 2014
    May 2014
    April 2014
    March 2014
    February 2014
    January 2014
    December 2013
    November 2013
    October 2013
    September 2013
    August 2013
    July 2013
    June 2013
    May 2013
    April 2013
    March 2013
    February 2013
    January 2013
    December 2012
    November 2012
    October 2012
    September 2012
    August 2012
    July 2012
    June 2012
    May 2012
    April 2012
    March 2012
    February 2012
    January 2012
    December 2011
    November 2011
    October 2011

UK Gold Trading Experts (UKGTE) is a trading name of Drupac Limited, a company registered in England and Wales (company number 09167819) whose registered office is 1 St. Paul's Square, Birmingham, B3 1QU.