UK Gold Trading Experts
  • Home
  • Trade Like a Pro
  • Gold Blog
  • Subscriber Resources
  • Legal Stuff
    • User Agreement
  • Contact Us

Gold Market Update - 30th Jun

30/6/2014

0 Comments

 
Friday's trading saw gold oscillate in a narrow range, forming a "doji" candlestick on the daily chart that signifies hesitation in the market - the bulls appear to have lost their momentum in the face of strong resistance at the 65 week MA and the long term down trend line, whilst the bears have not yet been able to attract enough support to force the price back below 1300.

This week could be a crticial one for gold with the price at such an important juncture and the participants finely balanced.  We suspect the bears will win out, as the odds favour a continuation of the well established down trend - a failure to break the 65 week MA will probably see a strong decline as bulls throw the towel in and new shorts take advantage of the market vulnerability.

Equities remain well supported and are near to all time highs, the dollar has fallen back to strong support at 80 and oil has given back some of its recent gains but is still trading above $105 a barrel.  We maintain our stance that gold will not enjoy a major rally until equities correct significantly.

Support can be found at 1310, 1306, 1300, 1289, 1285, 1263, 1257-1260, 1250-1252, 1237-1240, 1220-1225, 1210, 1200 and 1180.  A break of 1180 would have serious bearish implications for gold and suggest a decline to 1000-1050 in the short term - the break below 1250 seems to have been invalidated,
indicating that a return to 1180 is now less likely.

Resistance can be found at 1318-1322, 1330-1332, 1340-1342, 1352-1354, 1392-1395, 1400, 1420 and
1435.  We are now attempting to break the key 65 week MA - a break of this level would suggest that the intermediate down trend was at an end and higher prices are ahead.

Today's video for subscribers looks at the recent trading in more detail and our strategy for our next trade.
0 Comments

Gold Market Update - 26th Jun

26/6/2014

0 Comments

 
Gold has faltered at the critical moment, failing to build on the breakout above the 65 week MA and falling back below 1320.  The market is in danger of a sharp reversal here unless gold can break above this key resistance area, a decline that would confirm a second failure at this level in 2014.

The 4 hour chart is showing a clear and widening bearish divergence, suggesting that the market is building up to a sell off, with silver also faltering and oil finding resistance after a strong rally.

Equities are consolidating just below all time highs and the dollar's decline appears to have halted above the 80 level.

Support can be found at 1310, 1306, 1300, 1289, 1285, 1263, 1257-1260, 1250-1252, 1237-1240, 1220-1225, 1210, 1200 and 1180.  A break of 1180 would have serious bearish implications for gold and suggest a decline to 1000-1050 in the short term - the break below 1250 seems to have been
invalidated, indicating that a return to 1180 is now less likely.

Resistance can be found at 1318-1322, 1330-1332, 1340-1342, 1352-1354, 1392-1395, 1400, 1420 and 1435.  We are now attempting to break the key 65 week MA - a break of this level would suggest that the intermediate down trend was at an end and higher prices are ahead.

Today's video for subscribers looks at the recent trading in mroe detail and our strategy for our next trade.
0 Comments

Gold Market Update - 24th Jun

24/6/2014

0 Comments

 
Trade Gold Online Trader
Gold continued to consolidate last week's gains in a triangle pattern yesterday and this morning has broken out of the triangle to the upside as expected.

The price is currently trading around 1325, having broken above the critical 1322 level and above the 65 week MA for the first time since January 2013, some 18 months ago. 

This is potentially a key breakout for gold and suggests that the gold market has finally bottomed at 1180 and the bulls are back in the driving seat.

Equities are struggling to continue to move higher and the dollar is falling back towards 80, with oil holding above $105 a barrel, however as we pointed out in yesterday's blog update, gold appears to be less influenced by outside markets than has been the case for the past year or more.

Support can be found at 1318-1322, 1310, 1306, 1300, 1289, 1285, 1263, 1257-1260, 1250-1252, 1237-1240, 1220-1225, 1210, 1200 and 1180.  A break of 1180 would have serious bearish implications for gold and suggest a decline to 1000-1050 in the short term - the break below 1250 seems to have been invalidated, indicating that a return to 1180 is significantly less likely.

Resistance can be found at 1330-1332, 1340-1342, 1352-1354, 1392-1395, 1400, 1420 and 1435.  We are now attempting to break the key 65 week MA - a break of this level would suggest that the intermediate down trend was at an end and higher prices are ahead.

Today's video for subscribers looks at the recent trading in more detail and our thoughts for our next trade.

0 Comments

Gold Market Update - 23rd Jun

23/6/2014

0 Comments

 
Trade Gold Online Trader
After surging as high as the key level of 1322 on Thursday, gold consolidated near resistance levels on Friday and this morning, suggesting that another leg higher is approaching.

The triangle consolidation around 1315 is a bullish formation and a strong move higher would have significant long term consequences for gold - the yellow metal is on the verge of breaking the long term down trend line and the 65 week MA.

This would suggest a return to the intermediate term bull market and should see much higher prices.  However, the last attempt by gold to break through the 65 week MA was unsuccessful and was followed by a sharp and sustained sell off that saw gold fall $150 in the following 3 months.

Equities remain near all time highs and the dollar is still above 80 despite the recent sell off, whilst oil remains elevated at $107 a barrel.  Interestingly, gold appears to have taken charge of its own destiny somewhat recently, with the influence of outside markets fading.

Support can be found at 1310, 1306, 1300, 1289, 1285, 1263, 1257-1260, 1250-1252, 1237-1240, 1220-1225, 1210, 1200 and 1180.  A break of 1180 would have serious bearish implications for gold and suggest a decline to 1000-1050 in the short term - the break below 1250 seems to have been invalidated, indicating that a return to 1180 is significantly less likely.

Resistance can be found at 1319-1322, 1330-1332, 1340-1342, 1352-1354, 1392-1395, 1400, 1420 and 1435.  We are now testing the key 65 week MA - a break of this level would suggest that the intermediate down trend was at an end.

Today's video for subscribers looks at the recent trading in more detail and our strategy for our next trade.

0 Comments

Gold Market Update - 20th Jun

20/6/2014

0 Comments

 
Trade Gold Online Trader
Gold started the day in positive mode yesterday, moving higher to test Monday's weekly high at 1285 (also being the 50 DMA).

On successfully breaching the 1285 level, gold exploded higher on technical buying, bouyed by the unrest in Iraq and a plunging dollar.

Gold surged as high as key resistance at 1322, smashing through the 200 DMA at 1289 and the 100 DMA at 1300 in the process and also sweeping straight through the congestion zone between 1290 and 1310.

More importantly from a long term perspective, gold has reached the key 65 week MA and is testing the long term down trend line - a break of this level will be a significant move and suggest that the bulls are back in control on all timeframes.

Support can be found at 1300, 1289, 1285, 1263, 1257-1260, 1250-1252, 1237-1240, 1220-1225, 1210, 1200 and 1180.  A break of 1180 would have serious bearish implications for gold and suggest a decline to 1000-1050 in the short term - the break below 1250 seems to have been invalidated, indicating that a return to 1180 is significantly less likely.

Resistance can be found at 1319-1322, 1330-1332, 1340-1342, 1352-1354, 1392-1395, 1400, 1420 and 1435.  We are now testing the key 65 week MA - a break of this level would suggest that the intermediate down trend was at an end.

Today's video for subscribers looks at the reent trading in more detail and our thoughts for our next trade.

0 Comments

Gold Market Update - 17th Jun

17/6/2014

0 Comments

 
Trade Gold Online Trader
Gold surged higher in early trading yesterday, finding resistance at the 50 DMA at 1285 before reversing sharply and ending the day well down, forming a "shooting star" candlestick on the daily chart.

This reliable reversal pattern was confirmed with follow through selling this morning that has taken the price down as low as support at the 200 hour MA at 1263.

We expect the price to decline rapidly now that the top is in for the recent rally, with a break of 1240 the first target for the bears, who will fancy thier chances of testing 1180 this time.  The 200 hour MA may provide some support though once that level breaks, 1240 should come around relatively quickly (gold always falls much harder and faster than it rises).

Support can be found at 1263, 1257-1260, 1250-1252, 1237-1240, 1220-1225, 1210, 1200 and 1180.  A break of 1180 would have serious bearish implications for gold and suggest a decline to 1000-1050 in the short term - this prospect now looks more likely and the break below 1250 gives us an indication of a likely eventual return to 1180.

Resistance can be found at 1277-1280, 1283, 1289, 1293-1296, 1304-1305, 1309, 1314-1315, 1319-1322, 1330-1332, 1340-1342, 1352-1354, 1392-1395, 1400, 1420 and 1435.  The failure to break above the 65 week MA suggests that the intermediate down trend remains in play.

0 Comments

Gold Market Update - 13th Jun

13/6/2014

0 Comments

 
Trade Gold Online Trader
Gold powered higher yesterday, hitting the 61.8% retracement of the recent decline before finding resistance.  The market has also reached the 20 DMA and we expect the down trend, which we still consider to be the dominant trend, to resume from here.

Equities remain at or near all time highs and the dollar strength has taken the index close to 81 in recent days - these factors will limit gold's potential advance from here.

A surging oil price, in all likelihood linked to the unrest in Iraq and Syria, has helped gold in recent days, though this kind of market driven reaction often reverses as quickly as it appears.

Support can be found at 1270, 1257-1260, 1250-1252, 1237-1240, 1220-1225, 1210, 1200 and 1180.  A break of 1180 would have serious bearish implications  for gold and suggest a decline to 1000-1050 in the short term - this  prospect now looks more likely and the break below 1250 gives us an indication of a likely eventual return to 1180.

Resistance can be found at 1277-1280, 1283, 1289, 1293-1296, 1304-1305, 1309, 1314-1315, 1319-1322, 1330-1332, 1340-1342, 1352-1354, 1392-1395, 1400, 1420 and 1435.  The failure to break above the 65 week MA suggests that the intermediate down trend remains in play.

Today's video for subscribers looks at the recent trading in more detial and our strategy for our next trade.

0 Comments

Gold Market Update - 10th Jun

9/6/2014

0 Comments

 
Trade Gold Online Trader
In quiet trading yesterday, gold traded in a very narrow $7 range as the market continued to consolidate following last week's sharp decline.

The pattern developing appears to be a "bear flag" that suggests further downside once the oversold condition of the market has unwound, which seems to be almost complete.

Gold is struggling to hold above support at 1250 in the face of surging equities making new all time highs and a rallying dollar holding above support at 80.50.  Although there are increasing calls for a correction in equities, in our experience bull markets continue for longer than most expect and defy the negative voices, climbing a "wall of worry".

Support can be found at 1250-1252, 1237-1240, 1220-1225, 1210, 1200 and 1180.  A break of 1180 would have serious bearish implications for gold and suggest a decline to 1000-1050 in the short term - this prospect now looks more likely and the break below 1250 gives us an indication of a likely return to 1180.

Resistance can be found at 1257-1260, 1268, 1274-1277, 1283, 1289, 1293-1296, 1304-1305, 1309, 1314-1315, 1319-1322, 1330-1332, 1340-1342, 1352-1354, 1392-1395, 1400, 1420 and 1435.  The failure to break above the 65 week MA suggests that the intermediate down trend remains in play.

Today's video for subscribers looks at the recent trading in more detail and our strategy for our next trade.

0 Comments

Trade Your Way to Financial Freedom!

7/6/2014

0 Comments

 
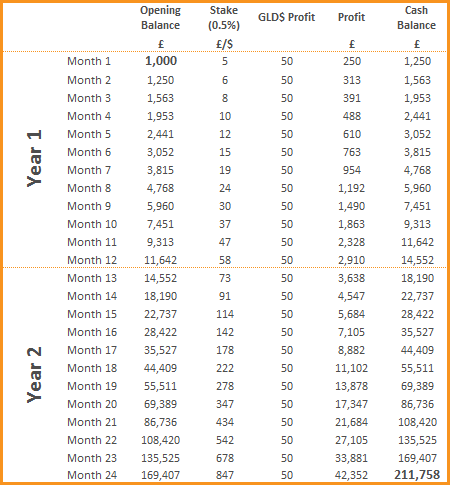
It really is possible to turn £1,000 into over £200,000 within just 2 years.  I know that sounds crazy, but it is absolutely true…but only if you understand how to trade the gold market and can muster the necessary discipline to apply a methodical, rigorous trading approach.
The table on the right show exactly how the maths work…it couldn’t be simpler – you start your trading fund with just £1,000, calculating your stake at 0.5% per $ of gold price movement.  

That means for every $ that the price of gold moves in the direction you’ve bet on you earn 0.5% of your fund (which is £5 if your fund starts at £1,000).

You can bet on the price of gold moving higher or lower – it’s not like buying shares where you have buy low and sell high…you can bet on the price falling if you like – which (considering gold lost over $700 per ounce in value from its high point in September 2011 to June 2013) is a good thing!
Trade Gold Online
Over the course of a month, if you “gained” $50 of correctly predicted price movement in gold you’d earn a profit of £250 (£5 stake per $ multiplied by $50 of correctly predicted movement).

The price of gold fluctuates throughout the month, some months moving as much as $300.  In the course of just one day it’s not uncommon for the price to go up by $30 and then fall by $40 – providing a trading range of $70 on the day.  

Remember, we’re able to bet on price movements both up and down, so picking up $50 of correctly predicted price movement isn’t as much as it may seem.
Gold Trading Success
As each month goes by you continue to stake just half a percent of your trading fund per $ of gold price movement – as your fund increases so does the value of your stake, but overall as a percentage of your fund you are risking exactly the same as when you had just £1,000 in the kitty.

This compounding action quickly grows your fund to a point where, just 2 years after you started, your fund is worth over £200,000!
You can continue the calculations yourself – you’ll be amazed at how quickly that number can reach the millions…but you’ll want to either start drawing-down earnings or reducing your stake around this point, so don’t get too carried away!

So if it’s that simple, what could possibly go wrong??

Well…everything!
Most independent online traders lose money.  Like with most things in life, you have to invest time (and usually money) to learn how to do something well before you’re even close to competent…and isn’t it normally the case that the more worthwhile or valuable whatever it is you’re attempting to master is, the harder it is to succeed.

You always get some gifted individuals who pick things up naturally, but they’re the exception…in most cases you have to commit and dedicate yourself to learning.
Click for Our Gold Trading Success
Trading gold is not easy.  It sometimes feels like it is when you know what you’re doing – some trades are so obvious that they jump off the screen…but you can easily get caught out.  
Join Us at Gold Trading Experts
Mastering the different technical analysis techniques, knowing what to use and what, and understanding how the macro-economic picture impacts the gold market are all vital to becoming an expert and successful gold trader. 

To the novice trader, or someone new to the gold market, this can sound like a foreign language and is understandably off-putting…which is why we have made it our mission to help you succeed.
We have distilled our knowledge and expertise into a set of structured tutorials which will take you from novice to expert in the shortest timeframe possible, whilst providing you with direct access to our experts throughout your learning and beyond – rather than you scouring the web for useful resources and working out how it all fits together without ever being sure, we’ve packaged everything up into a service that will make you a gold trading expert and set you on your journey to financial freedom!
0 Comments

Gold Market Update - 6th Jun

6/6/2014

0 Comments

 
Trade Gold Online Trader
After finding support around 1240 over the past few days, gold jumped sharply higher yesterday following the release of economic stimulus details by the ECB.

Although the ECB confirmed further stimulus measures, the package announced was seen as less aggressive than expected and this saw the Euro move higher and the dollar decline.

Gold and equities both moved higher, though the rally in gold was quickly capped at 1257 and this morning the price is struggling to maintain a foothold above 1250, with little follow through buying after yesterday's pop.

Equities surged to new all time highs and are continuing to forge higher this morning, with the dollar also regaining some lost ground around 80.50.  The May NFP number is slated for release at 1.30pm UK time - a strong number will further boost equities and the dollar and see gold back on the defensive and a weak number will have the opposite effect.

Support can be found at 1250-1252, 1237-1240, 1220-1225, 1210, 1200 and 1180.  A break of 1180 would have serious bearish implications for gold and suggest a decline to 1000-1050 in the short term - this prospect now looks more likely and the break below 1250 gives us an indication of a likely return to 1180.

Resistance can be found at 1257-1260, 1268, 1274-1277, 1283, 1289, 1293-1296, 1304-1305, 1309, 1314-1315, 1319-1322, 1330-1332, 1340-1342, 1352-1354, 1392-1395, 1400, 1420 and 1435.  The failure to break above the 65 week MA suggests that the intermediate down trend remains in play.

Today's video for subscribers looks at the recent trading in more detail and the price movements in the wake of the ECB annoucenment yesterday.

0 Comments
<<Previous

    Old Posts

    August 2021
    July 2021
    June 2021
    May 2021
    March 2021
    February 2021
    January 2021
    December 2020
    November 2020
    March 2019
    January 2019
    December 2018
    October 2018
    September 2018
    August 2018
    July 2018
    June 2018
    May 2018
    March 2018
    February 2018
    July 2017
    June 2017
    May 2017
    April 2017
    March 2017
    February 2017
    January 2017
    December 2016
    July 2016
    March 2016
    December 2015
    November 2015
    October 2015
    September 2015
    August 2015
    July 2015
    June 2015
    May 2015
    April 2015
    March 2015
    February 2015
    January 2015
    December 2014
    November 2014
    October 2014
    September 2014
    August 2014
    July 2014
    June 2014
    May 2014
    April 2014
    March 2014
    February 2014
    January 2014
    December 2013
    November 2013
    October 2013
    September 2013
    August 2013
    July 2013
    June 2013
    May 2013
    April 2013
    March 2013
    February 2013
    January 2013
    December 2012
    November 2012
    October 2012
    September 2012
    August 2012
    July 2012
    June 2012
    May 2012
    April 2012
    March 2012
    February 2012
    January 2012
    December 2011
    November 2011
    October 2011

UK Gold Trading Experts (UKGTE) is a trading name of Drupac Limited, a company registered in England and Wales (company number 09167819) whose registered office is 1 St. Paul's Square, Birmingham, B3 1QU.