UK Gold Trading Experts
  • Home
  • Trade Like a Pro
  • Gold Blog
  • Subscriber Resources
  • Legal Stuff
    • User Agreement
  • Contact Us

Gold Market Update - 29th May

29/5/2014

0 Comments

 
Picture
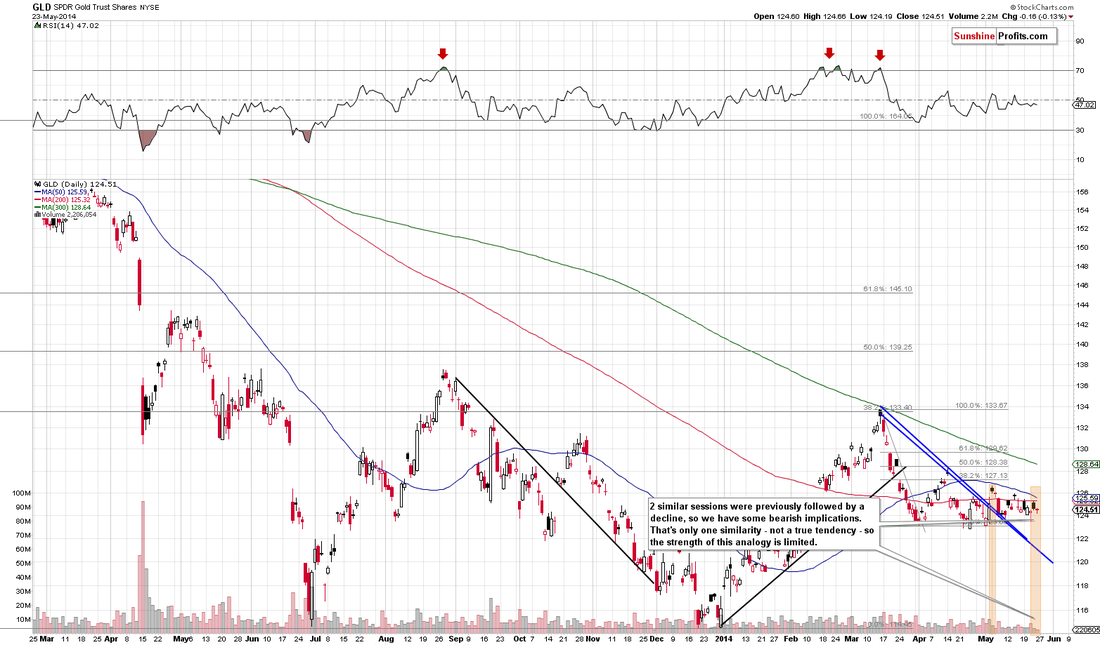
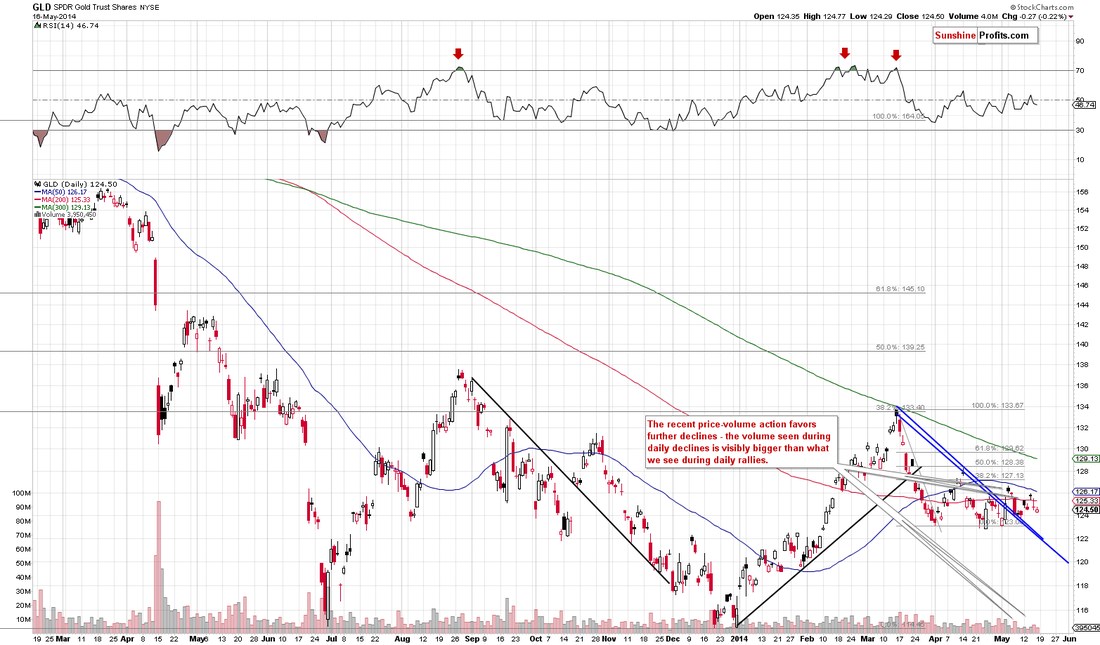
Gold continued to sell off yesterday, falling below the 61.8% retracement level at 1261.  This morning the down leg has made a new low, touching 1251 as the decline gathers momentum.

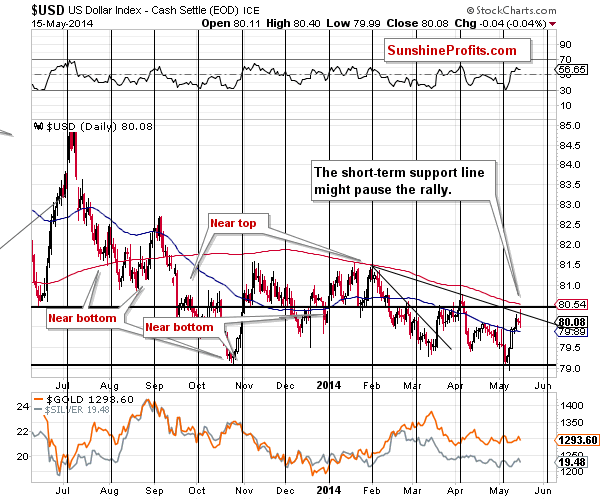
The RSI is very oversold on the 4 hour chart, suggesting a short term bounce is near, though we expect the 80 or 200 hour MA to provide resistance on any counter trend rally, with a return to 1180 now looking more likely than a return to 1300.

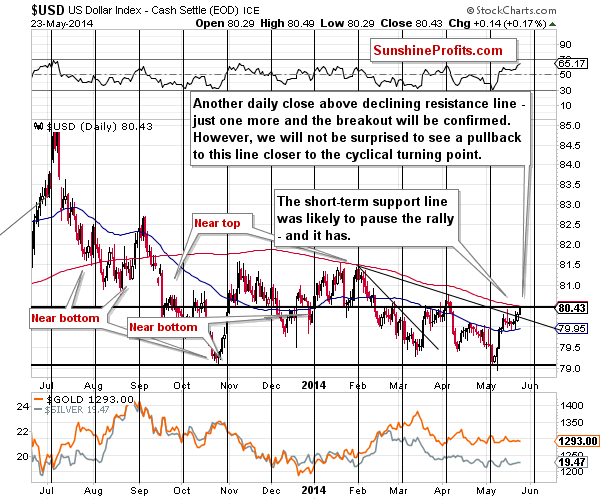
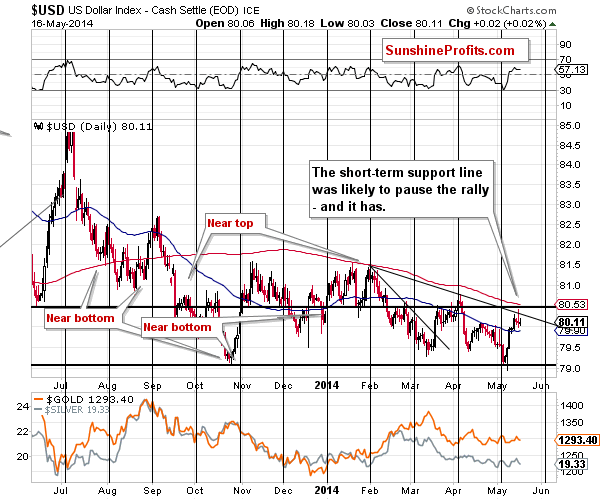
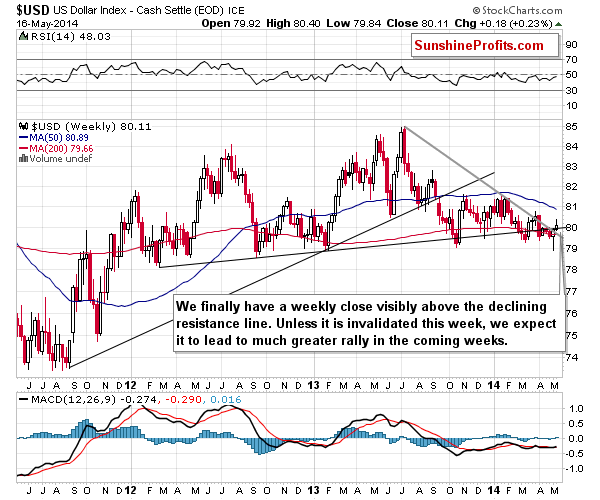
Equities are at all time highs and have broken above stiff resistance, suggesting a powerful new up leg is underway.  The dollar strength is also continuing, pressuring gold further.

Support can be found at 1250-1255, 1237-1240, 1220-1225, 1210, 1200 and 1180.  A break of 1180 would have serious bearish implications for gold and suggest a decline to 1000-1050 in the short term - this prospect now looks more likely and we are watching for a break below 1250 for confirmation of a likely return to 1180.

Resistance can be found at 1260, 1268, 1274-1277, 1283, 1289, 1293-1296, 1304-1305, 1309, 1314-1315, 1319-1322, 1330-1332, 1340-1342, 1352-1354,  1392-1395, 1400, 1420 and 1435.  The impulsive breakout above the first down trend line on the weekly chart suggests an end to the intermediate term down trend, however the 65 week MA must be broken before a significant rally can develop.

Today's video for subscribers looks at the unfolding decline in more detail and our strategy for our next trade.

0 Comments

Gold Trading Update - 28th May

28/5/2014

0 Comments

 
Trade Gold Online Trader
Gold took a significantly bearish turn yesterday, crashing through the lower boundary of the triangle pattern and tumbling as low as 1261, significantly closing below the key 24 April low at 1268.

The 1261 area represents the 61.8% retracement level of the 2014 rally and a break of this support level will suggest a return to 1180 is on the cards.

The picture now looks bleak for gold, with the dollar strength continuing and equities breaking through resistance to embark on a new rally leg.  We expect a short pause and a mild rally from an oversold position before the down leg starts with gusto.

Support can be found at 1261, 1250-1255, 1237-1240, 1220-1225, 1210, 1200 and 1180.  A break of 1180  would have serious bearish implications for gold and suggest a decline to 1000-1050 in the short term, this prospect now looks more likely and we are watching for a break below 1250.

Resistance can be found at 1268, 1274-1277, 1283, 1289, 1293-1296, 1304-1305, 1309, 1314-1315, 1319-1322, 1330-1332, 1340-1342, 1352-1354,  1392-1395, 1400, 1420 and 1435.  The impulsive breakout above the first down trend line on the weekly chart suggests an end to the intermediate term down trend, however the 65 week MA must be broken before a significant rally can develop.

Today's video for subscribers looks at the breakout of the triangle in more detail and our strategy or our next trade.

0 Comments

Gold & Silver Trading Alert: More of the Same – For How Long?

28/5/2014

0 Comments

 
Gold & Silver Trading Alert originally published on May 27th, 2014 7:51 AM by sunshineprofits

Briefly: In our opinion speculative short positions (half) in gold, silver, and mining stocks are justified from the risk/reward perspective.

The history repeats itself once again – gold just attempted to move higher but failed to ignite anything more than a small daily rally. Let’s see if there’s anything that this can tell us (charts courtesy of http://stockcharts.com). 
Picture
There’s one clue. It’s not a very strong one, but at least we have something new to comment on. The last 2 sessions were very similar to what we had seen at the beginning of the month. Back then gold declined quite visibly, so perhaps the same reaction will be seen also this time. In this case, such a decline would have more bearish consequences, as it would take gold below the previous lows and such a breakdown would likely lead to further declines.

Other than that, there’s not much that we can say about the changes in the gold market itself. What we wrote about gold in the previous alert remains up-to-date:

We wrote that the strength that we could see here would likely be temporary. It turned out that the rally that this reversal generated was indeed very small and temporary. We saw another lower intra-day high in gold, and the move higher materialized on low volume. We’re once again seeing this bearish combination. If the USD Index confirms its breakout, gold might finally break below the short-term support.

How far can it go initially? Our best guess at this particular moment (this might change as the situation develops) is the $1,200 level or close to it. One of the ways to estimate the size of a given move is to assume that the move following the consolidation (which we’ve been seeing since the beginning of April) will be similar to the one preceding it. In this case, the move following the breakdown could be similar to the March decline, and such a move would take gold close to the $1,200 level. This level is very close to the 2013 lows, so we expect gold to pause there (but not to end the decline).

There is not much to comment on in case of silver and mining stocks but the situation in the USD Index has changed more visibly.
Picture
The U.S. dollar moved higher once again and almost confirmed the breakout above the declining resistance line. Precious metals are not reacting yet. Unless metals start to react to the dollar’s strength (by declining) we will view this as a sign of their strength. For now we still think that the reaction is delayed – not really absent.

One of the reasons for the lack of reaction could be the situation in the silver market. 
Picture
Silver is right at its support line. In addition to the 2013 lows this is the key support level that prevents silver from moving much lower – to the $14 - $16 target area. Once this level is broken, silver may and likely will move sharply lower. Being this significant, it’s no wonder that this support line is not easy to break. Since gold, silver, and mining stocks are highly correlated in the short term, it’s also no wonder that silver’s refusal to move lower already is accompanied by a similar refusal in the case of gold and mining stocks.

Summing up, the outlook for gold, silver, and mining stocks remains bearish, but not extremely bearish, which means that we are not increasing the size of the short position just yet. Precious metals are not responding strongly to the dollar’s rallies so far, but it seems that investors and traders are simply waiting for a confirmation of the breakout in the USD Index (there have been cases when the metals’ reaction was delayed in the past).

To summarize:

Trading capital (our opinion): Short positions (half) in: gold, silver, and mining stocks with the following stop-loss orders:

- Gold: $1,326

- Silver: $20.30

- GDX ETF: $25.20

Long-term capital (our opinion): No positions

Insurance capital (our opinion): Full position

You will find details on our thoughts on gold portfolio structuring in the Key Insights section on our website.

As always, we'll keep our subscribers updated should our views on the market change. We will continue to send them our Gold & Silver Trading Alerts on each trading day and we will send additional ones whenever appropriate. If you'd like to receive them, please subscribe today.

Thank you.

Przemyslaw Radomski, CFA

Founder, Editor-in-chief

Tools for Effective Gold & Silver Investments - SunshineProfits.com

Tools für Effektives Gold- und Silber-Investment - SunshineProfits.DE

* * * * *

Disclaimer

All essays, research and information found above represent analyses and opinions of Przemyslaw Radomski, CFA and Sunshine Profits' associates only. As such, it may prove wrong and be a subject to change without notice. Opinions and analyses were based on data available to authors of respective essays at the time of writing. Although the information provided above is based on careful research and sources that are believed to be accurate, Przemyslaw Radomski, CFA and his associates do not guarantee the accuracy or thoroughness of the data or information reported. The opinions published above are neither an offer nor a recommendation to purchase or sell any securities. Mr. Radomski is not a Registered Securities Advisor. By reading Przemyslaw Radomski's, CFA reports you fully agree that he will not be held responsible or liable for any decisions you make regarding any information provided in these reports. Investing, trading and speculation in any financial markets may involve high risk of loss. Przemyslaw Radomski, CFA, Sunshine Profits' employees and affiliates as well as members of their families may have a short or long position in any securities, including those mentioned in any of the reports or essays, and may make additional purchases and/or sales of those securities without notice.

0 Comments

Gold Market Update - 27th May

27/5/2014

0 Comments

 
Trade Gold Online Trader
Gold continues to meander sideways within the triangle consolidation pattern and is now approaching the apex of the triangle.  We are therefore very close to a breakout either higher or lower, with the upper boundary of the triangle coming in at 1298 and the lower boundary at 1286.

This morning gold is testing the lower boundary at 1286, suggesting a downside breakout could be imminent, however the trading is light and volumes are low.  Equities, oil and the dollar are all virtually flat, though a slew of data from the US later in the session may see some life return to markets.

The future direction of gold will be dependant on the trading direction of the dollar and whether equities can break out above stiff resistance and continue to make new all time highs.

Support can be found at 1285-1288, 1278, 1273, 1267, 1250-1255, 1237-1240, 1220-1225, 1210, 1200 and 1180.  A break of 1180  would have serious bearish implications for gold and suggest a decline  to 1000-1050 in the short term, though this now looks unlikely unless we  break below 1250.

Resistance can be found at 1304-1305, 1309, 1314-1315, 1319-1322, 1330-1332, 1340-1342, 1352-1354,  1392-1395, 1400, 1420 and 1435.  The impulsive breakout above the first down trend line on the weekly chart suggests an end to the intermediate term down trend, however the 65 week MA must be broken before a significant rally can develop.

Today's video for subscribers looks at the triangle consolidation in more detail and our thoughts for gold's next move.

0 Comments

Gold Market Update - 23rd May

23/5/2014

0 Comments

 
Trade Gold Online Trader
This week, gold has traded within a very narrow range between 1283 and 1305 as the triangle consolidation pattern moves towards a conclusion.

The next couple of weeks are crucial for the long term trading direction of gold - the trading range is converging on the long term resistance line and 65 week MA at 1330-1340, a break of this key resistance point will see gold rally sharply towards, and probably through, 1500.

However, another failure at this level would see the price fall sharply back toards major support at 1180, a break of which will be very bearish and suggest a return to 1000-1050 as a minimum.

The S&P remains at all time highs, though hasn't yet broken decisively through the 1895 major resistance area whilst the dollar rally continues and oil is trading above $103 a barrel.

Support can be found at 1285-1288, 1278, 1273, 1267, 1250-1255, 1237-1240, 1220-1225, 1210, 1200 and 1180.  A break of 1180 would have serious bearish implications for gold and suggest a decline to 1000-1050 in the short term, though this now looks unlikely unless we break below 1250.

Resistance can be found at 1304-1305, 1309, 1314-1315, 1319-1322, 1330-1332, 1340-1342, 1352-1354, 1392-1395, 1400, 1420 and 1435.  The impulsive breakout above the first down trend line on the weekly chart suggests an end to the intermediate term down trend, however the 65 week MA must be broken before a significant rally can develop.

Today's video for subscribers looks at the long term picture in more detail and our strategy for our next trade.

0 Comments

Gold Market Update - 20th May

20/5/2014

0 Comments

 
Picture
Gold remains within the narrow channel between the 50 and 100 DMA.  After moving to the upper boundary of the triangle yesterday and failing to break out, the price declined back below 1300 and the short term mixed picture remains in play.

The dollar strength needs to be watched - after rallying powerfully off long term support at 79, the dollar has stalled just above 80.  A resumption of the rally will be bearish for gold, particularly a break above 80.40, whilst a sustained decline back towards 79 would give the yellow metal a boost.

Equities remain well supported and near to all time highs, diverting funds and interest away from gold as they have for the past couple of years - a strong breakout above 1900 would be very bearish for gold.

Support can be found at 1285-1288, 1278, 1273, 1267, 1250-1255, 1237-1240, 1220-1225, 1210, 1200 and 1180.  A break of 1180 would have serious bearish implications for gold and suggest a decline to 1000-1050 in the short term, though this now looks unlikely unless we break below 1250.

Resistance can be found at 1295, 1304-1305, 1309, 1314-1315, 1319-1322, 1330-1332, 1340-1342, 1352-1354, 1392-1395, 1400, 1420 and 1435.  The impulsive breakout above the first down trend line on the weekly chart suggests an end to the intermediate term down trend, however the 65 week MA must be broken before a significant rally can develop.

Today's video for subscribers looks at the recent trading in more detail and reviews the longer term chart patterns.

0 Comments

Gold & Silver Trading Alert: Critical Support in Silver

19/5/2014

0 Comments

 
Gold & Silver Trading Alert originally published on May 19th, 2014 10:52 AM:

Briefly: In our opinion speculative short positions (half) are justified from the risk/reward perspective in gold, silver, and mining stocks.

The previous week started quite favorably for precious metals bulls, but as the week progressed, the situation became less bullish, and finally we saw some bearish signs. Overall, the previous week didn’t change much. Let’s take a closer look (charts courtesy of http://stockcharts.com). 
Picture
In the previous alerts we wrote a lot about gold, silver and miners’ reaction to the dollar’s rally (more precisely: about the lack of reaction) and the strength of the implications. In short, we didn’t think that the consequences were really bullish, because there had been many cases when the precious metals’ reaction was simply delayed, not absent. We saw some other bearish signs, but we’ll move to them in the following part of this alert. As far as the USD Index is concerned, we saw a pause after a strong rally. It was nothing surprising, as the previous rally was quite sharp and the index moved to the short-term resistance line.

What’s interesting is that while the first part of the last week was rather bullish for metals – they didn’t decline despite the dollar’s rally – the final part of the week was bearish as metals declined without a rally in the dollar. It could be the case that metals are starting to catch up as far as their reaction to the dollar’s rally is concerned.

Has the USD Index really paused or is the rally already over? 
Picture
The medium-term chart suggests that the move higher has just begun as we saw a breakout above the important resistance line, and we saw a weekly close above it. Another move higher will further confirm the breakout and likely convince more traders that the currency is really about to rally substantially in the coming weeks.

This means that the biggest (bearish) impact on the precious metals sector is still ahead of us.
Picture
The situation in the gold market didn’t improve on Friday, and what we wrote in Friday’s alert remains up-to-date:

Yesterday, we wrote that GLD ETF had moved higher on tiny volume, which was a bearish sign. Another bearish sign (or more precisely: not a bullish one) was that we didn’t have gold above the previous local high. Moreover, we emphasized that this week’s small upswing hadn’t made gold move above the 50-day moving average and that the small move higher still seemed to be a counter-trend move.

The above is up-to-date and yesterday’s session confirms it – the GLD declined on volume that was significantly bigger than the volume accompanying the previous daily rallies.

The price-volume signs continue to point to lower prices in the coming days.
Picture
Mining stocks moved lower even more visibly than gold did. In fact, please note that while gold is above its March and April lows, the GDX ETF has just closed slightly below them. Mining stocks are showing weakness and suggest that another move will be to the downside.

What we wrote previously about the mining stocks sector remains up-to-date:

The “lower highs” observation applied to the mining stocks sector and the bearish price-volume implications were seen here as well. Just as it is the case with the gold market, the situation remains bearish, and yesterday’s decline on relatively big volume confirms it.

The precious metals sector usually declines in the middle of May, so we have bearish implications also from this perspective.

Before we summarize, let’s take a look at the long-term silver chart.
Picture
In the May 15, 2014 Alert we wrote the following:

Silver, on the other hand, has moved visibly higher this week. Is this a bullish factor? Not necessarily. Silver’s outperformance used to be a very bullish signal in the past years, but that was not the case in the more recent past. Since March all cases of silver’s outperformance (and many cases before that) have been the final sell signals for the precious metals sector.

History – the recent history – seems to have repeated itself once again. Silver moved sharply higher only to disappoint in the following days. Overall, the white metal moved higher by only $0.15, which means that it was basically flat.

The important factor to keep in mind here is that silver was (at the beginning of the week) and once again is right at its rising support line. Once this line is broken, we can expect a big (say, more than $1) move lower. It’s quite visible – many traders realize this. With this in mind, it’s no wonder that the current support was the start of a sharp rally. However, the fact that the rally was only very temporary and followed by an immediate move back to this line means that the strength of buyers is smaller than the strength of sellers.

Summing up, the outlook for gold, silver, and mining stocks remains bearish, but not extremely bearish, which means that we don’t increase the size of the short position just yet. Precious metals are not responding strongly (we saw some reaction in the final part of last week, though) to the dollar’s rallies so far, but it seems that investors and traders are simply waiting for a confirmation of the breakout in the USD Index (there have been cases when the metals’ reaction was delayed in the past). Plus, silver’s strong performance and the lack thereof in the case of mining stocks, plus lower highs in gold and mining stocks, are a bearish combination.

To summarize:

Trading capital (our opinion): Short positions (half) in: gold, silver, and mining stocks with the following stop-loss orders:

- Gold: $1,326

- Silver: $20.30

- GDX ETF: $25.20

Long-term capital (our opinion): No positions

Insurance capital (our opinion): Full position

You will find details on our thoughts on gold portfolio structuring in the Key Insights section on our website.

As always, we'll keep our subscribers updated should our views on the market change. We will continue to send them our Gold & Silver Trading Alerts on each trading day and we will send additional ones whenever appropriate. If you'd like to receive them, please subscribe today.

Thank you.

Przemyslaw Radomski, CFA

Founder, Editor-in-chief

Tools for Effective Gold & Silver Investments - SunshineProfits.com

Tools für Effektives Gold- und Silber-Investment - SunshineProfits.DE

* * * * *

Disclaimer

All essays, research and information found above represent analyses and opinions of Przemyslaw Radomski, CFA and Sunshine Profits' associates only. As such, it may prove wrong and be a subject to change without notice. Opinions and analyses were based on data available to authors of respective essays at the time of writing. Although the information provided above is based on careful research and sources that are believed to be accurate, Przemyslaw Radomski, CFA and his associates do not guarantee the accuracy or thoroughness of the data or information reported. The opinions published above are neither an offer nor a recommendation to purchase or sell any securities. Mr. Radomski is not a Registered Securities Advisor. By reading Przemyslaw Radomski's, CFA reports you fully agree that he will not be held responsible or liable for any decisions you make regarding any information provided in these reports. Investing, trading and speculation in any financial markets may involve high risk of loss. Przemyslaw Radomski, CFA, Sunshine Profits' employees and affiliates as well as members of their families may have a short or long position in any securities, including those mentioned in any of the reports or essays, and may make additional purchases and/or sales of those securities without notice.

0 Comments

Gold & Silver Trading Alert: Important Price-Volume Link

19/5/2014

0 Comments

 
Gold & Silver Trading Alert originally published on May 16th, 2014 8:16 AM: by Przemyslaw Radomski, CFA of sunshineprofits.com

Briefly: In our opinion speculative short positions (half) are justified from the risk/reward perspective in gold, silver, and mining stocks.

The situation in the currency and precious metals markets developed to a large extent as we had outlined it yesterday. The USD Index paused, but gold, silver, and mining stocks caught up a bit in terms of the reaction to the previous dollar’s moves. Let’s take a closer look (charts courtesy of http://stockcharts.com). 
Picture
Basically, everything that we wrote yesterday about the USD Index, remains up-to-date:

The USD Index paused after moving very close to the declining short-term resistance line. That’s not really surprising – the previous move up had been quite sharp, so it’s no wonder that we saw a breather. No market can move up or down without any corrections. However, the USD Index is after long- and medium-term breakouts and thus the continuation of the rally is to be expected.

The short-term USD Index chart reveals that there is one additional resistance level that needs to be taken out before the USD can rally much higher – the declining line based on the February and April highs. Once we have the USD Index above this line and the breakout is confirmed, traders should become convinced that the next move in the U.S. dollar is up, and that’s when we might see metals and miners finally respond to the USD Index’ strength (by declining).
Picture
Yesterday, we wrote that GLD ETF had moved higher on tiny volume, which was a bearish sign. Another bearish sign (or more precisely: not a bullish one) was that we didn’t have gold above the previous local high. Moreover, we emphasized that this week’s small upswing hadn’t made gold move above the 50-day moving average and that the small move higher still seemed to be a counter-trend move.

The above is up-to-date and yesterday’s session confirms it – the GLD declined on volume that was significantly bigger than the volume accompanying the previous daily rallies.
Picture
The “lower highs” observation applied to the mining stocks sector and the bearish price-volume implications were seen here as well. Just as it is the case with the gold market, the situation remains bearish, and yesterday’s decline on relatively big volume confirms it.


The precious metals sector usually declines in the middle of May, so we have bearish implications also from this perspective.

Summing up, the outlook for gold, silver, and mining stocks remains bearish, but not extremely bearish, which means that we don’t increase the size of the short position just yet. Precious metals are not responding strongly (we have seen some reaction yesterday, though) to the dollar’s rallies so far, but it seems that investors and traders are simply waiting for a confirmation of the breakout in the USD Index (there have been cases when the metals’ reaction was delayed in the past). Plus, silver’s strong performance and the lack thereof in the case of mining stocks, plus lower highs in gold and mining stocks are a bearish combination.

To summarize:

Trading capital (our opinion): Short positions (half) in: gold, silver, and mining stocks with the following stop-loss orders:

- Gold: $1,326

- Silver: $20.30

- GDX ETF: $25.20

Long-term capital (our opinion): No positions

Insurance capital (our opinion): Full position

You will find details on our thoughts on gold portfolio structuring in the Key Insights section on our website.

As always, we'll keep our subscribers updated should our views on the market change. We will continue to send them our Gold & Silver Trading Alerts on each trading day and we will send additional ones whenever appropriate. If you'd like to receive them, please subscribe today.

Thank you.

Przemyslaw Radomski, CFA

Founder, Editor-in-chief

Tools for Effective Gold & Silver Investments - SunshineProfits.com

Tools für Effektives Gold- und Silber-Investment - SunshineProfits.DE

* * * * *

Disclaimer

All essays, research and information found above represent analyses and opinions of Przemyslaw Radomski, CFA and Sunshine Profits' associates only. As such, it may prove wrong and be a subject to change without notice. Opinions and analyses were based on data available to authors of respective essays at the time of writing. Although the information provided above is based on careful research and sources that are believed to be accurate, Przemyslaw Radomski, CFA and his associates do not guarantee the accuracy or thoroughness of the data or information reported. The opinions published above are neither an offer nor a recommendation to purchase or sell any securities. Mr. Radomski is not a Registered Securities Advisor. By reading Przemyslaw Radomski's, CFA reports you fully agree that he will not be held responsible or liable for any decisions you make regarding any information provided in these reports. Investing, trading and speculation in any financial markets may involve high risk of loss. Przemyslaw Radomski, CFA, Sunshine Profits' employees and affiliates as well as members of their families may have a short or long position in any securities, including those mentioned in any of the reports or essays, and may make additional purchases and/or sales of those securities without notice.

0 Comments

Gold Market Update - 19th May

19/5/2014

0 Comments

 
Picture
Gold continues to trade in a narrow range bounded by the 100 DMA at the bottom and the 50 DMA at the top in quiet, choppy trading action.

This morning gold is trading slightly higher and is back above the 80 and 200 hour MAs at 1302.  The triangle pattern will soon be resolved, with the odds favouring a downside breakout as the trend continues in the direction it was going before the triangle correction.

Equities remain near all time highs, though are struggling to break stiff major resistance at 1885-1895 and the dollar is trading around 80 once more.  Further dollar weakness, particularly a move back towards 79, will give gold a boost and a break of key support at 79 would be very bullish for gold.

Support can be found at 1296-1298, 1291, 1285-1287, 1278, 1273, 1267, 1250-1255, 1237-1240, 1220-1225, 1210, 1200 and 1180.  A break of 1180 would have serious bearish implications for gold and suggest a decline to 1000-1050 in the short term, though this now looks unlikely unless we break below 1250.

Resistance can be found at 1309, 1314-1315, 1319-1322, 1330-1332, 1340-1342, 1352-1354, 1392-1395, 1400, 1420 and 1435.  The impulsive breakout above the first down trend line on the weekly chart suggests an end to the intermediate term down trend, however the 65 week MA must be broken before a significant rally can develop.

Today's video for subscribers recaps last week's trading and looks at our trading strategy for the week.

0 Comments

Gold Market Update - 15th May

15/5/2014

0 Comments

 
Trade Gold Online Trader
Gold bounced off the 100 DMA yesterday before rising as high as 1309, almost touching the 50 DMA at the top of the recent trading range.

Gold is trading around 1303 this morning at the top boundary of the "triangle" pattern and is back above the 80 and 200 hour MA, in short term bullish mode.

The interesting aspect of the last couple of week's trading has been the relationship between gold and the dollar.  As the dollar has rallied powerfully this last week, gold has help up remarkably well - yesterday as the dollar retreated, gold moved higher.

This is in marked contrast to the recent trading where gold would sell off sharply on dollar rallies and tread water during dollar declines.  An important change in the offing perhaps?

Equities remain near all time highs and continue to take some of the limelight away from gold and other commodities, however oil is moving higher again and is now trading above $102 a barrel.

Support can be found at 1296-1298, 1291, 1285-1287, 1278, 1273, 1267, 1250-1255, 1237-1240, 1220-1225, 1210, 1200 and 1180.  A break of 1180 would have serious bearish implications for gold and suggest a decline to 1000-1050 in the short term, though this now looks unlikely unless we break below
1250.

Resistance can be found at 1309, 1314-1315, 1319-1322, 1330-1332, 1340-1342, 1352-1354, 1392-1395, 1400, 1420 and 1435.  The impulsive breakout above the first down trend line on the weekly chart suggests an end to the intermediate term down trend, however the 65 week MA must be broken before a
significant rally can develop.

Today's video for subscribers looks at the recent trading in more detail and our short term trading thoughts.

0 Comments
<<Previous

    Old Posts

    August 2021
    July 2021
    June 2021
    May 2021
    March 2021
    February 2021
    January 2021
    December 2020
    November 2020
    March 2019
    January 2019
    December 2018
    October 2018
    September 2018
    August 2018
    July 2018
    June 2018
    May 2018
    March 2018
    February 2018
    July 2017
    June 2017
    May 2017
    April 2017
    March 2017
    February 2017
    January 2017
    December 2016
    July 2016
    March 2016
    December 2015
    November 2015
    October 2015
    September 2015
    August 2015
    July 2015
    June 2015
    May 2015
    April 2015
    March 2015
    February 2015
    January 2015
    December 2014
    November 2014
    October 2014
    September 2014
    August 2014
    July 2014
    June 2014
    May 2014
    April 2014
    March 2014
    February 2014
    January 2014
    December 2013
    November 2013
    October 2013
    September 2013
    August 2013
    July 2013
    June 2013
    May 2013
    April 2013
    March 2013
    February 2013
    January 2013
    December 2012
    November 2012
    October 2012
    September 2012
    August 2012
    July 2012
    June 2012
    May 2012
    April 2012
    March 2012
    February 2012
    January 2012
    December 2011
    November 2011
    October 2011

UK Gold Trading Experts (UKGTE) is a trading name of Drupac Limited, a company registered in England and Wales (company number 09167819) whose registered office is 1 St. Paul's Square, Birmingham, B3 1QU.