UK Gold Trading Experts
  • Home
  • Trade Like a Pro
  • Gold Blog
  • Subscriber Resources
  • Legal Stuff
    • User Agreement
  • Contact Us

Gold Market Update - 27th Jan

27/1/2015

0 Comments

 
LONG TERM TREND:                   BEARISH
INTERMEDIATE TERM TREND:    NEUTRAL
SHORT TERM TREND:                 BULLISH
VERY SHORT TERM TREND:       BEARISH

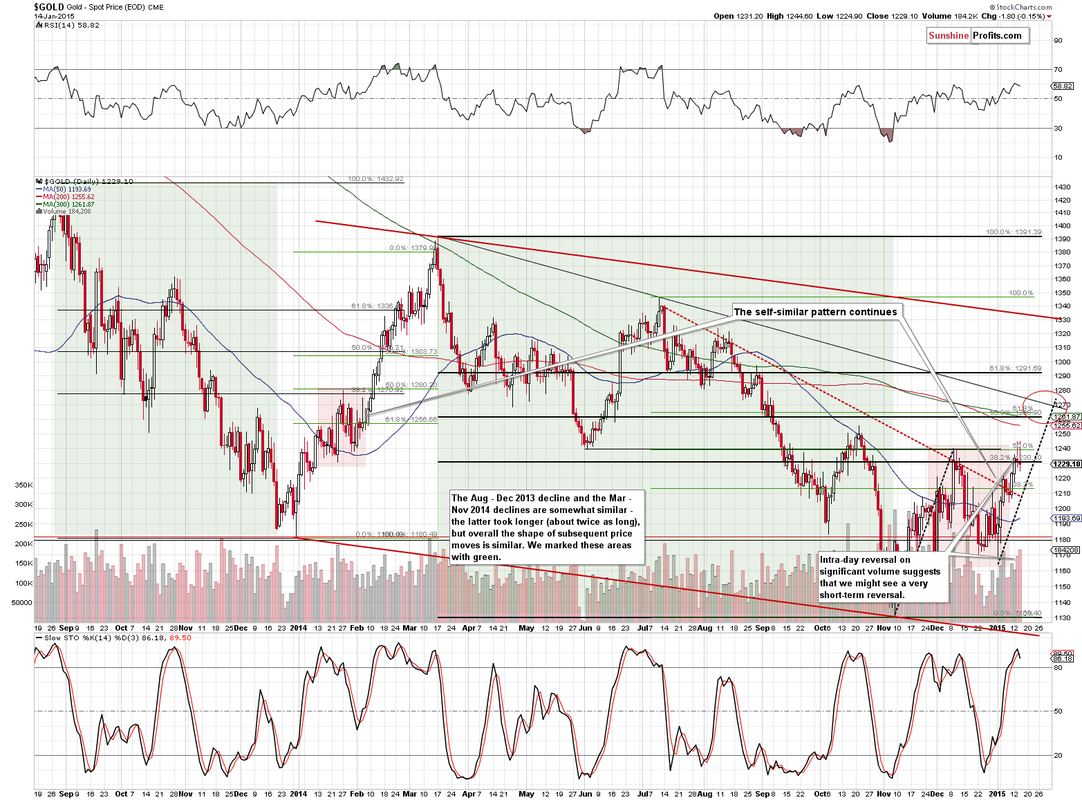
After finding resistance at 1305 last week, gold has started to correct as we predicted, with the low of 1272 so far coming in at the 23.6% Fib retracement of the rally from 1167 to 1305.

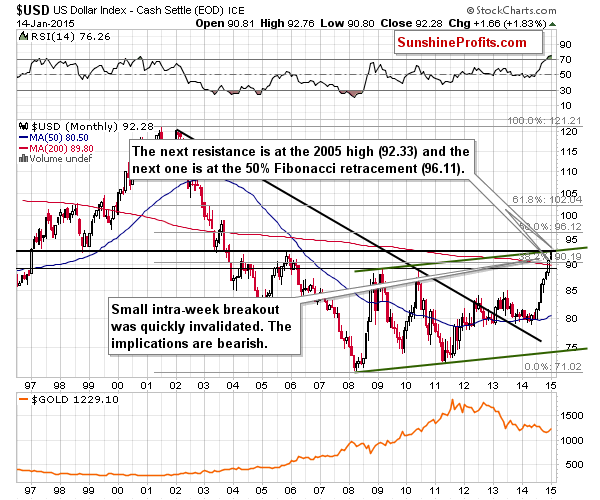
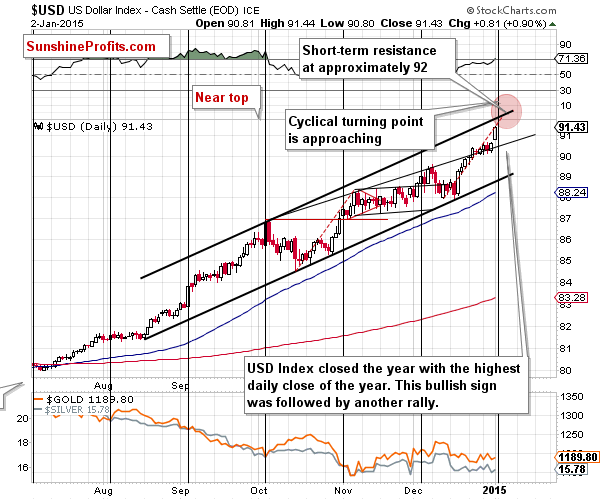
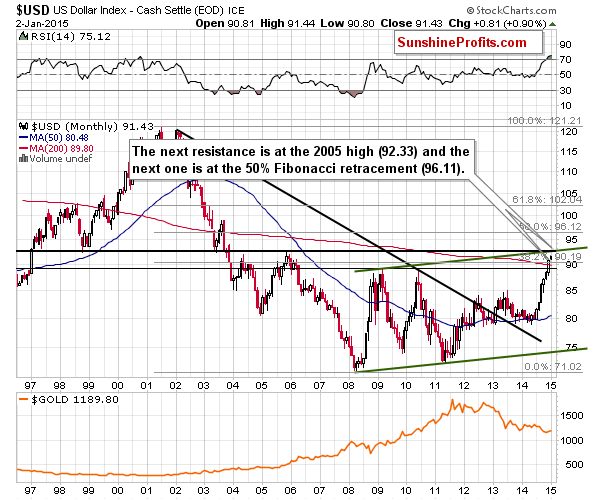
We expect the rally to continue once the current correction has run it's course (our subscribers are aware of our targets for the correction) despite the continuing dollar strength.  It appears that both gold and the dollar are benefiting from the "safe haven" trade, particularly in respect of European investors worried about the short term weakness in (and the long term viability of) the Euro.

Equities remain well off all time highs, however any declines are being seen as buying opportunities as the indices make their way higher - the non existent inflation and dim prospects for interest rate rises make the dividend yields on blue chip equities appealing even as stock prices rise.

Oil remains firmly entrenched in a down trend with new lows below $45 a barrel seen yesterday.

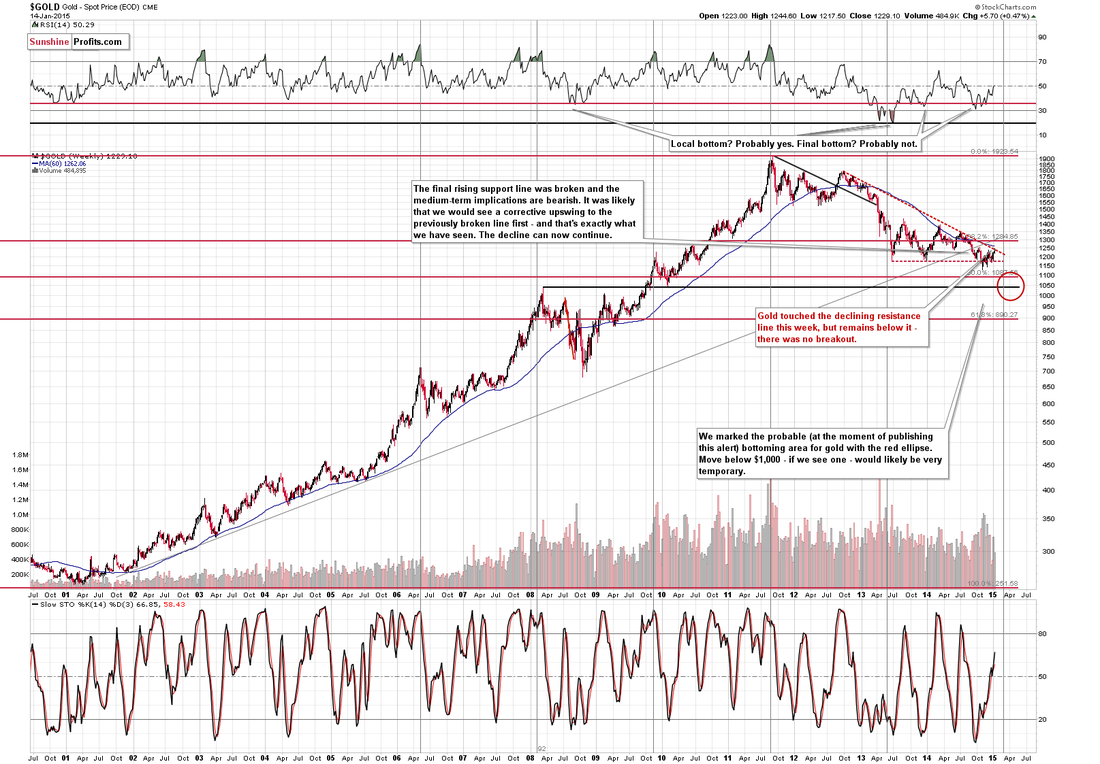
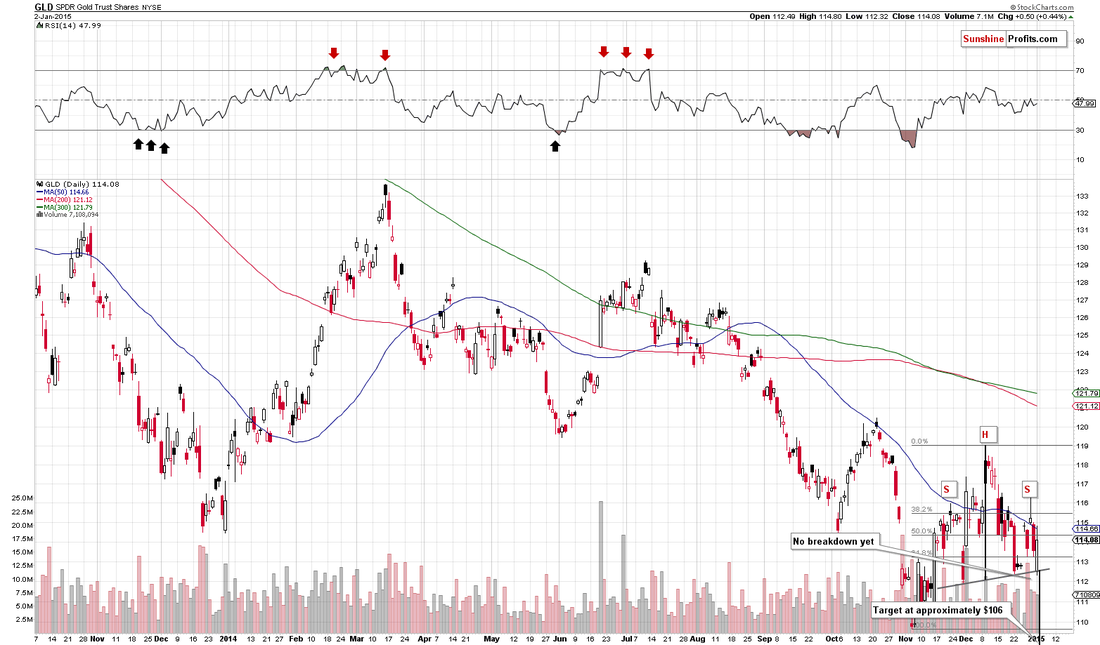
Support can be found at 1272, 1268, 1256, 1245, 1222-1225, 1210, 1204, 1200, 1192, 1180-1183, 1175-1178, 1172, 1167, 1154, 1145-1147, 1131, 1124, 1100, 1085, 1045 and 1000. Gold has bounced back after breaking below the critical 1180 level and is now moving higher after a classic "bear trap".  The break of the intermediate down trend suggests a new rally phase is just beginning.

Resistance can be found at 1282-1284, 1290-1292, 1300-1302, 1305, 1310-1312, 1322-1325, 1333-1335 and 1345.  The break of the intermediate down trend line in an impulsive move higher suggests an end to the down trend and the start of a new rally leg in gold.

Today's video for subscribers looks at the recent trading in more detail and our strategy for today's trading session.
0 Comments

Gold Market Update - 22nd Jan

22/1/2015

0 Comments

 
LONG TERM TREND:                   BEARISH
INTERMEDIATE TERM TREND:    NEUTRAL
SHORT TERM TREND:                 BULLISH
VERY SHORT TERM TREND:       BULLISH

Gold found resistance yesterday at 1305 after a classic 5-wave impulsive rally leg.  The retreat back from 1305 formed a "doji" candlestick on the daily chart and the follow through weakness today suggests a short term top is in place, however the significance of this rally cannot be underestimated.

We have now shifted our strategy from "sell the rallies" - a stance that has served us so well for the last couple of years - to a "buy the dips" mentality.

We expect a retracement here before the rally resumes with targets well north of 1300 in the short term.  The recent rally is all the more impressive as it has coincided with a powerful rally in the dollar (is gold anticipating a USD top?), however the recent announcement by the ECB of a huge expansion to QE likely to see further dollar strength.

Equities remain well supported and any dips are being seen as buying opportunities, whilst oil remains very weak near $47 a barrel.

Support can be found at 1280-1282, 1272, 1268, 1256, 1245, 1222-1225, 1210, 1204, 1200, 1192, 1180-1183, 1175-1178, 1172, 1167, 1154, 1145-1147, 1131, 1124, 1100, 1085, 1045 and 1000. Gold has bounced back after breaking below the critical 1180 level and is now moving higher after a classic "bear trap".  The break of the intermediate down trend suggests a new rally phase is just beginning.

Resistance can be found at 1282, 1290-1292, 1300-1302, 1305, 1310-1312, 1322-1325, 1333-1335 and 1345.  The break of the intermediate down trend line in an impulsive move higher suggests an end to the down trend and the start of a new rally leg in gold.

Today's video for subscribers looks at the recent trading in more detail and our strategy for today's trading session.


0 Comments

Gold Market Update - 19th Jan

19/1/2015

0 Comments

 
LONG TERM TREND:                   BEARISH
INTERMEDIATE TERM TREND:    NEUTRAL
SHORT TERM TREND:                 BULLISH
VERY SHORT TERM TREND:       BULLISH

Gold continued to rally sharply at the end of last week in an impulsive move higher that saw the price touch the upper boundary of the intermediate term channel at 1282.  We are therefore likely to see a pause in the rally to consolidate gains.

The rally in gold has been all the more impressive as it has been in conjunction with a sharp rally in the dollar - the US currency is now at multi-year highs near 93.

Equities have corrected sharply as gold has moved higher, with the S&P dipping below 2000 last week.  Oil has recovered off multi-year lows below $45 a barrel to trade at $48.50 this morning however the trend is clearly still down in crude oil.

Support can be found at 1268, 1256, 1245, 1222-1225, 1210, 1204, 1200, 1192, 1180-1183, 1175-1178, 1172, 1167, 1154, 1145-1147, 1131, 1124, 1100, 1085, 1045 and 1000. Gold has bounced back after breaking below the critical 1180 level and is now moving higher after a classic "bear trap".  The break of the intermediate down trend suggests a new rally phase is just beginning.

Resistance can be found at 1282, 1290-1292, 1300-1302, 1310-1312, 1322-1325, 1333-1335 and 1345.  The break of the intermediate down trend line in an impulsive move higher suggests an end to the down trend and the start of a new rally leg in gold.

Today's video for subscribers looks at the recent trading in more detail and our strategy for today's trading session.
0 Comments

Gold & Silver Trading Alert: Breakout or a Single-Event-Driven Upswing?

16/1/2015

0 Comments

 
Gold & Silver Trading Alert originally published on January 15th, 2015 9:36 AM: 

Briefly: In our opinion no speculative positions are currently justified from the risk/reward perspective. Being on the long side of the precious metals market with half of the long-term investment capital seems justified from the risk/reward perspective. 

We saw another daily reversal in gold yesterday, during which gold touched its declining medium-term resistance line. Gold broke above this level early today, so we have a breakout. With gold trading above this important line it’s critical to take into account the reason behind it and to remember that waiting for a confirmation of a given move proved to be profitable many times in the past.  

In short, during yesterday’s session we saw a repeat of the previous day’s signals and the comments that we made yesterday remain up-to-date. Given another daily reversal in gold and a move lower in gold stocks, it seems that taking profits on our previous long positions yesterday was a good idea. Yes, gold rallied today in pre-market trading, but it seems that this was just the market’s overreaction to the news from Switzerland (decision to remove the Swiss franc’s peg to the euro). It’s not very important for the gold market, but a huge move in the Swiss franc has probably triggered safe-haven buying. Again, it seems to be a one-time event, which doesn’t necessarily change the outlook based on yesterday’s closing prices. The outlook could change if we see closing price above critical resistance levels for gold, silver and mining stocks, but that’s something that we will be able to discuss after today’s session (in tomorrow’s alert). 

Let’s take a look at the charts (charts courtesy of http://stockcharts.com).
Picture
The situation in the USD Index didn’t change at all on Wednesday, so our previous comments remain up-to-date: 

In the previous alerts we emphasized the significance of the long-term resistance that was just reached. It – combined with short-term resistance and the cyclical turning point – was likely to stop the current rally and trigger a correction. It seems that we are seeing the beginning thereof.

The USD Index moved a little above the long-term resistance last week, but this “breakout” was quickly invalidated and the USD ended the week below the key resistance. In fact, the weekly reversal is a bearish sign on its own.
Picture
Even though the USD Index is likely to have a bullish impact on gold in the coming weeks, we have just seen a move to a declining medium-term resistance line, which means that a local top could be in. The resistance is relatively strong, so even if gold is to move higher in the coming weeks, we could still see a corrective downswing shortly. 

Gold moved above this resistance line in today’s pre-market trading, but at this time the breakout is not confirmed (there has not even been a single close above it).
Picture
From a daily perspective we saw another bearish piece of action in gold yesterday. In fact, we saw what resembled Tuesday’s action. The yellow metal reversed on significant volume, which was a bearish sign. Moreover, it invalidated the move above the previous December 2014 high, which makes the very short-term outlook even more bearish. Does it make the outlook very bearish? Not necessarily. Our previous comments remain up-to-date: 

Gold closed at the price level that is close to the early Dec. high (in terms of the daily closing prices), so we can say that gold reached a resistance level and could pause or correct at this time. Still, that seems rather unlikely (or any correction would likely not be significant) because the U.S. dollar’s decline has not really begun so far. If it materializes, then the price of gold will likely rally regardless of the short-term resistance.

(…) 

Will gold stop at $1,260 - $1,280? 

That’s just our initial target. Much will depend on the way gold reacts to the dollar’s decline and the way gold stocks react to gold’s performance – we will be monitoring the situation.

Before seeing today’s price action we thought that it was likely that gold would move lower first and start another rally to $1,260 - $1,280 a little later. However, gold has already moved slightly above the $1,260 level. Is the top in? It seems likely that we are in a situation similar to what happened on Dec. 1, 2014. The outlook seems similar as well – since today’s action is single-event-based, we could see some more strength today as investors and traders react to news from Switzerland, but we could see a correction in the following days. Please note that there has been no visible correction since the beginning of this year and the current rally is much sharper than the previous (Nov. – Dec. 2014) one. 
Picture
The HUI Index (proxy for gold stocks) moved visibly lower on Tuesday and it declined also yesterday, practically invalidating Monday’s rally. The key question is: “what does ‘practically’ mean here?” On the above HUI chart, we see a move back below the 2014 low, which is a very bearish sign.
Picture
However, the above GDX ETF chart (a different proxy for mining stocks) shows that we saw a move back to the 2014 low without a daily close back below it. This would imply that yesterday’s and Tuesday’s moves lower were nothing more than just verifications of the breakout. This interpretation has bullish implications.  

With unclear implications of yesterday’s move, the implications for the short term are also unclear.
Picture
The silver chart tells us that the medium-term trend remains down - there was not even a move back above the rising long-term resistance line. Have we reached a local top? It’s quite likely that we’re close to one (as the long-term resistance is close), but the above chart doesn’t tell us if it’s already behind us.  

Let’s keep in mind that we saw sharp rallies in silver (and silver’s temporary outperformance of gold and mining stocks) right before big declines and very close to local tops in the past. We saw such a development in silver on Tuesday, which was one of the reasons for which we decided to close our previous speculative long positions and cash in the profits.  

Summing up, gold moved higher in today’s pre-market trading, but it could be the case that today’s single-event-driven rally is followed by a short-term correction when the situation in the Swiss franc stabilizes. The breakout above the medium-term resistance line in gold is not confirmed, so there are no significant bullish implications. The situation was bearish for the very short term just yesterday, so it’s unclear if today’s session will really change a lot. Consequently, it seems that being out of the precious metals market with the speculative capital is justified from the risk/reward perspective – at least for now.  

Based on several bearish signs and today’s bullish action in gold, it seems that waiting for an additional confirmation before getting back on the long side of the market (for instance in the form of a small decline that is followed by the outperformance of gold stocks) is justified from the risk/reward point of view. 

We are not changing the long-term investment approach at this time – it seems that half of the capital should be invested in the market, mainly because the USD Index is likely to move lower relatively soon and because gold more or less stopped reacting to the USD’s strength. 

We will probably get back on the long side of the market with the speculative / trading positions, but that’s not the case just yet.  

To summarize: 

Trading capital (our opinion): No positions 

Long-term capital (our opinion): Half positions in gold, half positions in silver, half position in platinum and half position in mining stocks. 

Insurance capital (our opinion): Full position 

You will find details on our thoughts on gold portfolio structuring in the Key Insights section on our website. 

Thank you.


Przemyslaw Radomski, CFA

Founder, Editor-in-chief

Gold Investment & Silver Investment at SunshineProfits.com
 

* * * * *
Disclaimer

All essays, research and information found above represent analyses and opinions of Przemyslaw Radomski, CFA and Sunshine Profits' associates only. As such, it may prove wrong and be a subject to change without notice. Opinions and analyses were based on data available to authors of respective essays at the time of writing. Although the information provided above is based on careful research and sources that are believed to be accurate, Przemyslaw Radomski, CFA and his associates do not guarantee the accuracy or thoroughness of the data or information reported. The opinions published above are neither an offer nor a recommendation to purchase or sell any securities. Mr. Radomski is not a Registered Securities Advisor. By reading Przemyslaw Radomski's, CFA reports you fully agree that he will not be held responsible or liable for any decisions you make regarding any information provided in these reports. Investing, trading and speculation in any financial markets may involve high risk of loss. Przemyslaw Radomski, CFA, Sunshine Profits' employees and affiliates as well as members of their families may have a short or long position in any securities, including those mentioned in any of the reports or essays, and may make additional purchases and/or sales of those securities without notice.
0 Comments

Gold Market Update - 15th Jan

15/1/2015

0 Comments

 
LONG TERM TREND:                   BEARISH
INTERMEDIATE TERM TREND:    NEUTRAL
SHORT TERM TREND:                 BULLISH
VERY SHORT TERM TREND:       BULLISH

The big news today is the surprise announcement by the Swiss central bank that they have ended the tie between the Swiss Franc and the Euro.  This move rocked markets and saw the Swissie surge by 30% against the Euro in early trading.  Maintaining the "peg" to 1.20 Euro has been getting more and more expensive for the Swiss central bank and this move is, in our view, in anticipation of further Quantitative Easing by the ECB, a move that would clearly weaken the Euro significantly.

Gold powered higher due to "safe haven" buying and on anticipation of QE from the ECB, smashing through the 1250 level and moving as high as 1261 before finding resistance as markets stabilised.  This move confirmed the end of the intermediate down trend and could be the start of a powerful new rally in the beleaguered yellow metal.

Equities were initially sharply lower due to the Swiss bank announcement ,however markets soon bounced back and are now trading flat.  Oil has finally found some buyers and is trading near to $50 a barrel whilst the dollar si down due to the surging strength of the Swiss Franc.

Support can be found at 1250, 1238, 1222, 1210, 1204, 1200, 1192, 1180-1183, 1175-1178, 1172, 1167, 1154, 1145-1147, 1131, 1124, 1100, 1085, 1045 and 1000. Gold has bounced back after breaking below the critical 1180 level and is now moving higher after a classic "bear trap".

Resistance can be found at 1261-1263, 1271-1273, 1290-1292, 1300-1302, 1310-1312, 1322-1325, 1333-1335 and 1345.  A third failure to break the down trend line on the weekly chart confirms that the intermediate down trend is intact, however the recent trading suggests the bulls may be building a base for a rally.

Today's video for subscribers looks at the recent trading in more detail and our strategy for today's trading session.
0 Comments

Gold Market Update - 12th Jan

12/1/2015

0 Comments

 
LONG TERM TREND:                   BEARISH
INTERMEDIATE TERM TREND:    NEUTRAL
SHORT TERM TREND:                 BULLISH/NEUTRAL
VERY SHORT TERM TREND:       BULLISH

There are some potentially interesting developments in gold today with the price breaking the 100 DMA and the intermediate term down trend line, suggesting the long established down trend may be over.

The weekly close in gold above 1222, in the face of a cratering oil price, rising equities and a surging dollar, is particularly encouraging for the bulls - the next target is 1238 after which a move towards 1300 should develop.

Support can be found at 1222, 1218, 1210, 1204, 1200, 1192, 1180-1183, 1175-1178, 1172, 1167, 1154, 1145-1147, 1131, 1124, 1100, 1085, 1045 and 1000.  Gold has bounced back after breaking below the critical 1180 level and appears to be trying to build a base to move higher in what would be a classic "bear trap".

Resistance can be found at 1235-1238, 1250, 1255, 1263, 1271-1273, 1290-1292, 1300-1302, 1310-1312, 1322-1325, 1333-1335 and 1345.  A third failure to break the down trend line on the weekly chart confirms that the intermediate down trend is intact, however the recent trading suggests the bulls may be building a base for a rally.

Today's video for subscribers looks at the recent trading in more detail and our strategy for today's trading session.
0 Comments

Top 5 Gold Stocks for January 2015

10/1/2015

0 Comments

 
The precious metals market isn’t really all about metals. Well, it sort of is but it is not ONLY about metals. Mining stocks are a significant part of the market and one that is very much interesting for gold and silver investors. In this commentary, we try to give you an idea why but we don’t stop there. We also discuss the 5 top gold stocks for January 2015 and let you know what might make a solid mining stock investment, in our opinion. 

Mining stocks is the general name for the stocks of companies extracting metals. The term is pretty self-explanatory, companies that qualify to this category mine metals, not only precious metals but also ores like copper. From the perspective of a precious metals investor, the most interesting mining stocks are those linked to gold, silver, platinum and, possibly to a lesser extent, palladium. In these considerations we’ll apply the term “mining stocks” in this restricted form, and only to senior mining stocks. 

A precious metals investor might be interested in mining stocks for a variety of reasons. First of all, mining stocks are readily available in the sense that you can buy them very much like you would buy any other kind of stock via your broker account. So, buying them is easy and the commissions on these transactions are not very high. Secondly, it’s not only easy to buy mining stocks, it’s also relatively easy to sell them, meaning that there usually is a wide range of possible buyers and sellers so you can close out your positions very quickly. This is what we would call “liquidity.” Thirdly, unlike buying physical gold, buying mining stocks doesn’t incur specific types of storage costs which might be quite significant. You only pay stock commissions and this means that holding mining stocks is generally cheaper than holding gold in designated vaults or via a custodian. If you’re interested in different ways to gain exposure to the precious metals market, you can delve right into our How to Buy section. There’s a whole article there on how to buy gold and silver mining stocks. 

The above are the basic advantages of mining stocks as a trading or investment vehicle but there are also finer points here. Miners might offer leverage but not necessarily in the traditional sense of operating on more debt. The leverage here would be possibility to multiply gold’s returns. In simple terms, on average, it is possible that if gold moves 1% up, some miners will move more than 1% up, thereby offering a multiplication effect. In this setting, an investor looking for exposure to the gold market could try to magnify their returns by including selected gold stocks in their portfolio. The catch here is which stocks to choose. Some will have leverage over 1, they will magnify gold’s returns (but also losses), some will have leverage below 1, diminishing returns (but also losses). Moreover, this is not a stable situation. Stocks with most leverage can “lose” it over time and, conversely, stocks with low leverage might “gain” it over time. In other words, if we were to rank gold stocks based on their leverage, they would trade places over time. 

From that stems the second subtle point. If the leverage of gold miners at any moment is negative, this would mean that a move up in gold could correspond to the stock moving down. While this might not look very attractive at first, think about times when gold plunges. In such periods of negative returns on gold, stocks with negative leverage could actually go up. This would be far from certain, but it seems that some miners can appreciate even in prolonged periods of falling gold prices. 

Sounds interesting? Leverage is not everything that matters in our approach, and we give more specific examples in just a few paragraphs. 

In discussing our top gold stocks picks for January 2015, we have to recognize that there is really no such thing as a “top gold stock” just as there is no such thing as the “best car in the world.” It all depends on what you need. If you’re into off-road experience, you might go in for a shiny 4x4 vehicle. But you might be more concerned with pure horsepower, in which case you might end up with a sports car. There are various possibilities here as different things might be of importance to you. In a way, choosing a best gold stock is the same. So we’ll explicitly write what our picks are based on. 

For ranking gold stocks, we’re going to use the Gold Stock Ranking, an in-house tool developed at Sunshine Profits, and subsequently made available for customers. This tool ranks gold stocks based on a number of factors, among them leverage as defined previously. For all our calculations, we assume that the person interested in gold stocks has low risk tolerance. This means that the person likes their gold stocks to track gold and would be inclined to sell them if they underperformed gold. Before we proceed, we would like to stress that our tools are not providing “investment advice” – they are available to help you make decisions on your own, but you will also need to take other factors into account while making investment decisions (tax implications would be one example).  

The distinction we’ll make now is based on how long the position is intended to be held. If the holding period is shorter than 6 months, we’ll consider this a short-term position. If the time horizon is longer, this will be called a long-term position. This might be different than you define the short and the long term but the most important part here is that the short-term time frame is more speculative and the long-term horizon is more of a fundamental investment. 

Let’s start off with the case when the approach is a short-term one. A short look at the Gold Stock Ranking (as of Jan. 7, 2015):
Picture
In the first column (“Ranking”) you see the place in the ranking. We limit our discussion to the 5 top stocks in the ranking but the Gold Stock Ranking itself computes all the values for 19 gold stocks of our choice. 

The second column (“Symbol”) is the symbol (ticker) of a given company you will see on stock exchanges. 

The third column (“Valuation”) shows you the valuation of the company relative to its “usual” value relative to gold (calculated according to our proprietary methodology). Positive values here mean that the stock might be overvalued relative to gold. By the same token, negative values might suggest that the company is undervalued relative to the yellow metal. 

The forth column (“Exposure”) shows you how well the company performs as a proxy for gold. It is based on the R-squared (statistical measure) for the gold stock and gold and can be interpreted as how well the price of the gold stock might be explained by the price of gold. 100% is the maximum value here, 0% the minimum. Generally, values over 50% might be considered as relatively significant. 

The fifth column (“Leverage”) should be familiar by now – this is the leverage relative to gold, as explained earlier in this article. In general, the higher the value in this column, the greater the leverage – the more the moves of the price of the gold stock have magnified the moves of the price of gold. A value above 1 means that the stock has, on average, outperformed gold, a value below 1 means that the stock has, on average, underperformed the yellow metal. A negative value shows that the stock has, on average, traded in the opposite direction than gold. 

Additionally, the interactive version of our investment tool gives you more info – for instance, moving the mouse cursor over the value in the first column will flash a short info on whether the stock might, on balance, be considered a valuable addition to a precious metals portfolio. 

Moving on to the specific values seen in the table, we see that Randgold Resources (GOLD) leads the pack with exposure at over 90% and leverage above 1.5. These seem like favorable values – the Randgold stock looks like it moves in the same direction as the price of gold and it also offers more bang for the buck than gold does, on average and based on past data. This is supported by the information the Gold Stock Ranking gives you: “Including GOLD [ticker for Randgold Resources] in your portfolio appears to be a good idea.” The valuation doesn’t seem to be too big a concern – Randgold might be almost 6% overvalued according to our methodology but this is not an extreme position. 

The second spot is taken by Royal Gold (RGLD), with exposure over 80% and leverage slightly over 1. These are generally speaking, values less favorable than what we’ve just observed for Randgold Resources, but still relatively favorable ones. The Gold Stock Ranking summarizes the situation by giving you info that “Including RGLD  in your portfolio appears to be a good idea.” One concern here is that Royal Gold seems to be overvalued relative to gold. The tool also gives you info that you might consider switching to other stocks close in the ranking but less overvalued (or even undervalued) around price bottoms. This could mean that Randgold could be a better choice during such times. 

Eldorado Gold (EGO) comes in third but with values visibly worse than the two previous stocks. Exposure is still above 50% and leverage above 1, but the Gold Stock Ranking distils this data into the suggestion that “Purchasing EGO might be useful for diversification purposes, but it seems that it’s not providing much advantage over investing in gold itself.” So, Eldorado is not exactly a terrible gold stock by our criteria but not a terrific one either. One positive thing about Eldorado is that it seems undervalued relative to gold. 

The remaining two stocks have visibly lower exposure and leverage values, which might suggest that they are not particularly interesting for an investor seeking exposure to gold with leverage as we have defined it. In fact, the Gold Stock Ranking suggests that “Purchasing [them] is not advised.” 

Now, let’s change the objective a bit and consider gold stocks that the tool suggests for a long-term position (as of Jan. 7, 2015). By that, we mean a position intended to be held for more than 6 months.
Picture
The top pick turns out to be Kinross Gold (KGC), with exposure close to 45% and leverage above 3. The exposure itself is perhaps not stellar but the leverage seems higher than was the case for a short-term position. The tool suggests: “Including KGC in your portfolio might be a good idea.” On a less positive note, Kinross Gold does look mildly overvalued relative to gold. This doesn’t seem to be extreme, though. If you recall, overvaluation means that it might be favorable to switch to less overvalued gold stocks around price bottoms. 

The second stock in this rating is Eldorado Gold (EGO) which we have already seen in the short-term ranking. Eldorado Gold has similar characteristics to Kinross Gold here, with marginally lower exposure around 45% and slightly lower leverage under 3 but it might be less overvalued. The Gold Stock Ranking suggests: “Including EGO in your portfolio might be a good idea.” It seems that this might particularly be the case around price bottoms where Eldorado Gold might be considered instead (or together with) Kinross Gold. Please note that it seems, based on the two rankings (short-term and long-term) that Eldorado might be a better vehicle for a long-term position than for a short-term one. 

Compañia de Minas Buenaventura (BVN) lands third with lower exposure and leverage values than the two previous stocks. Our ranking suggests: “Purchasing BVN might be useful for diversification purposes, but it seems that it’s not providing much advantage over investing in gold itself.” If you want to further diversify your portfolio (beyond Kinross and Eldorado), Buenaventura might be the stock to look at. 

The fourth place is occupied by Newmont Mining (NEM), which has exposure in the range of that seen for the two first stocks but visibly lower leverage and is slightly more overvalued than Eldorado. The tool suggests: "Purchasing NEM is not strongly discouraged, but it seems that you might want to choose other stocks or invest in gold itself.” 

The same goes for Royal Gold (RGLD), which has more favorable leverage and is the only undervalued stock in this top 5 (albeit only marginally) but also does seem to have less favorable exposure to gold. Also note that Royal Gold seems to be a more favorable vehicle for short-term positions (in our short-term ranking) than for long-term ones. 

Now, a more general thought. Based on our two rankings, it looks like in the short term the top gold stocks track gold relatively well but offer possibly limited leverage. Also, there are only two stocks suggested by the tool as picks. For the long term, there are only two suggested picks but no stock is discouraged as an investment. This might mean that currently short-term positions in gold stocks might track gold but won’t offer significant return multiplication. In the longer term, you can possibly expect less consistent tracking of the price of gold but multiplied returns (which might also mean multiplied losses). 

In this article, we have discussed the top 5 gold stocks for January according to our Gold Stock Ranking, delving into both short- and long-term positions. A more comprehensive ranking of gold miners can be found on the Gold Stock Ranking web page. Using this tool you can interactively adjust the ranking to the basic characteristics of your investment approach and get onscreen hints right away. Interested not only in gold stocks but also in silver miners? Check out our Silver Stock Ranking, which is a similar tool, only for silver stocks. 

Please note that the positions of gold stocks and silver stocks in the rankings change – while the changes are not necessarily visible on a day-to-day basis a week or month can change a lot. In order not to stick with stocks that stop outperforming, we think that rebalancing one’s holdings is appropriate. Based on our research best results were achieved by rebalancing gold stocks every 50 days and by rebalancing silver stocks every 20 days, when using the Golden Stock Ranking and the Silver Stock Ranking. This strategy has greatly outperformed the simple buy and gold approach. 

Finally, we can’t stress the importance of proper portfolio structuring so go and visit our page on the gold and silver portfolio, to learn why including various kinds of assets (not only gold and silver) in a precious metals portfolio might be the preferred way to go. 

Regards,

Mike McAra
Bitcoin Trading Strategist

Sunshine Profits: Gold & Silver, Forex, Bitcoin, Crude Oil & Stocks

Sunshine Profits: Gold & Silver Trading Alerts

Stay updated: sign up for our free mailing list today
 

* * * * *
Disclaimer
All essays, research and information found above represent analyses and opinions of Mike McAra and Sunshine Profits' associates only. As such, it may prove wrong and be a subject to change without notice. Opinions and analyses were based on data available to authors of respective essays at the time of writing. Although the information provided above is based on careful research and sources that are believed to be accurate, Mike McAra and his associates do not guarantee the accuracy or thoroughness of the data or information reported. The opinions published above are neither an offer nor a recommendation to purchase or sell any securities. Mr. McAra is not a Registered Securities Advisor. By reading Mike McAra’s reports you fully agree that he will not be held responsible or liable for any decisions you make regarding any information provided in these reports. Investing, trading and speculation in any financial markets may involve high risk of loss. Mike McAra, Sunshine Profits' employees and affiliates as well as members of their families may have a short or long position in any securities, including those mentioned in any of the reports or essays, and may make additional purchases and/or sales of those securities without notice.
0 Comments

Gold Market Update - 9th Jan

9/1/2015

0 Comments

 
LONG TERM TREND:                   BEARISH
INTERMEDIATE TERM TREND:      BEARISH/NEUTRAL
SHORT TERM TREND:                 NEUTRAL
VERY SHORT TERM TREND:        NEUTRAL

Gold remains within the wide range between 1222 and 1167 after moving to the top of the trading range following the release of the Non Farrms Payroll number this afternoon.

Gold remains at a crossroads, with the recent rally threatening to breach the long term down trend.  A close above 1222 would be very constructive for the bulls and suggest a move towards 1240 and eventually 1300 was underway.  However, a failure to move above 1222 would suggest a return to the bottom of the range at 1167 and potentially a more back to 1130 and beyond.

The powerful dollar rally shows no sign of abating, equities have recovered sharply following another sell off and oil remains very weak.  This environment is bearish for gold and would suggest that the 1222 level will hold and the bears will regain control.

Support can be found at 1210, 1204, 1200, 1192, 1180-1183, 1175-1178, 1172, 1167, 1154, 1145-1147, 1131, 1124, 1100, 1085, 1045 and 1000. Gold has bounced back after breaking below the critical 1180 level and appears to be trying to build a base to move higher in what would be a classic "bear trap".  However, the rally has so far been choppy and corrective in nature, suggesting a retest of 1131 is likely in due course.

Resistance can be found at 1222-1223, 1235-1238, 1250, 1255, 1263, 1271-1273, 1290-1292, 1300-1302, 1310-1312, 1322-1325, 1333-1335 and 1345.  A third failure to break the down trend line on the weekly chart confirms that the intermediate down trend is intact, however the recent trading suggests the bulls may be building a base for a rally.

Today's video for subscribers looks at the recent trading in more detail and our strategy for today's trading session.
0 Comments

Gold & Silver Trading Alert: Gold and Miners Refuse to Decline Despite Soaring USD

6/1/2015

0 Comments

 
Gold & Silver Trading Alert originally published on January 5th, 2014 8:08 AM:


Briefly: In our opinion no speculative short positions in gold, silver and mining stocks are currently justified from the risk/reward perspective. 

The USD Index soared much higher on Friday, well above the previous high. With the USD Index being so high, it seems odd that gold managed to close higher and the same went for mining stocks, which even outperformed the yellow metal. Is the rally in gold around the corner? 

Actually, it could be the case. We have been aiming to profit on the next decline in the precious metals market after a confirmation of the market’s weakness, most likely after a correction and continuation of a rally in the USD Index. However, the USD Index is already very high – well above the 90 level and relatively close to the resistance at 92.33. Since gold is not declining, it could be waiting for a bigger sign of weakness in the USD Index in order to start at least a short-term rally. This means that we might see an opportunity to go long very soon. 

Let’s see why, starting with the USD Index chart (charts courtesy of http://stockcharts.com).
Picture
The USD Index moved much higher and is now approaching its medium-term rising resistance line. The cyclical turning point is also just around the corner, which means that we will likely see a turnaround shortly.  

The resistance is just above the 92 level and the above chart is not the only one that tells us that this is the case.
Picture
The 2005 high (92.33) is the next major horizontal resistance and this level is more or less where the rising green resistance line is. There are two very important reasons for which we could see a corrective downswing or a decline after the USD Index reaches this level. 

Naturally, the USD Index could rally even higher, to the 96.11 level, but even if this is going to be the case, a corrective downswing after a move to 92.33 (or close to this level) is likely. 

All in all, a short-term decline seems to be likely for the USD Index, but not necessarily right away. The USD Index will probably need to first rally once again by approximately as much as it rallied last week.
Picture
Our previous comments for the long-term gold chart remain up-to-date: 

The events of the last three weeks didn’t change much as gold ended the previous week below $1,200 and – more importantly - well below the declining resistance line. The medium-term trend remains down. 

Please note that the long-term turning point will come into play in a few months – it may be the case that this is when the final bottom will form. 

However, another visible thing is that gold didn’t move below the previous lows while the USD Index was rallying. It seems likely that gold needs to move higher once again before it’s ready to move much lower. 
Picture
As far as the short term is concerned, we see that the head-and-shoulders was completed but immediately invalidated and at this time there are no bearish implications. The target based on this formation is at about $106 for the GLD ETF, which corresponds to about $1,100 in spot gold. This target will become very probable only once we see a confirmed breakdown below the neck level of the head-and-shoulders pattern.  

For now, we can say that gold has been showing strength lately by refusing to decline in spite of the U.S. dollar’s rally.
Picture
The situation in the GDX ETF is rather tense because of 2 things. The first thing is the fact that the 50-moving average was broken only insignificantly. As we wrote previously, that’s the average that has been stopping local rallies since late November. We now see a 5th attempt to move above it. The implications are bearish. 

The other important thing is that mining stocks moved higher by over 3% on Friday, which is significant as gold rallied only a little and the USD rallied strongly. This is bullish. The only reason that it’s not very bullish is that the volume that accompanied Friday’s rally was relatively low – it was not a huge-volume rally that would confirm the strength of the move. 

Since all the recent attempts failed and history tends to repeat itself, we are quite likely to see another local top relatively soon.  

Please note that even if miners rallied from here – say to the $20 level or so – it would not really change the bearish outlook for the medium term. 

Summing up, if gold and mining stocks continue to show strength relative to the USD Index and the latter moves to the 92.33 level or very close to it, we will strongly consider (after examining other factors) opening speculative long positions in the precious metals sector. We are not at this point just yet. If, however, we see a confirmed breakdown below the head and shoulders formation in the GLD ETF, we will probably open a short position in the precious metals sector. Either way, we will be monitoring the market for additional signs and confirmations and report to you – our subscribers - accordingly. 

To summarize: 

Trading capital (our opinion): No positions 

Long-term capital (our opinion): No positions 

Insurance capital (our opinion): Full position 

You will find details on our thoughts on gold portfolio structuring in the Key Insights section on our website. 

Thank you. 

Przemyslaw Radomski, CFA

Founder, Editor-in-chief

Tools for Effective Gold & Silver Investments - SunshineProfits.com

Tools für Effektives Gold- und Silber-Investment - SunshineProfits.DE 


* * * * *
Disclaimer
All essays, research and information found above represent analyses and opinions of Przemyslaw Radomski, CFA and Sunshine Profits' associates only. As such, it may prove wrong and be a subject to change without notice. Opinions and analyses were based on data available to authors of respective essays at the time of writing. Although the information provided above is based on careful research and sources that are believed to be accurate, Przemyslaw Radomski, CFA and his associates do not guarantee the accuracy or thoroughness of the data or information reported. The opinions published above are neither an offer nor a recommendation to purchase or sell any securities. Mr. Radomski is not a Registered Securities Advisor. By reading Przemyslaw Radomski's, CFA reports you fully agree that he will not be held responsible or liable for any decisions you make regarding any information provided in these reports. Investing, trading and speculation in any financial markets may involve high risk of loss. Przemyslaw Radomski, CFA, Sunshine Profits' employees and affiliates as well as members of their families may have a short or long position in any securities, including those mentioned in any of the reports or essays, and may make additional purchases and/or sales of those securities without notice.
0 Comments

Gold Market Update - 5th Jan

5/1/2015

0 Comments

 
LONG TERM TREND:                    BEARISH
INTERMEDIATE TERM TREND:     BEARISH/NEUTRAL
SHORT TERM TREND:                  NEUTRAL
VERY SHORT TERM TREND:        NEUTRAL

After a choppy end to 2014, as we enter the new year gold is trading just below the 1200 level within a wider trading range between 1167 and 1214.  We are watching this range for an indication of the next move, with a break below 1167 suggesting further declines and a break above 1214 indicative of a new rally phase.

We should see a clearer pattern emerge this week as traders return to their desks after the Christmas break and volumes increase accordingly.  The trading themes of 2014 appear to be continuing, with the dollar hitting 9 year highs around 91.50, oil tumbling towards $50 per barrel and equities remaining near all time highs.

As we have repeated many times before, this environment is not conducive to higher gold prices and we expect a move towards our long held target of 1000 early in 2015.

Support can be found at 1180-1183, 1175-1178, 1172, 1167, 1154, 1145-1147, 1131, 1124, 1100, 1085, 1045 and 1000. Gold has bounced back after breaking below the critical 1180 level and appears to be trying to build a base to move higher in what would be a classic "bear trap".  However, the rally has so far been choppy and corrective in nature, suggesting a retest of 1131 is likely in due course.

Resistance can be found at 1198, 1203, 1207, 1213, 1222-1223, 1235-1238, 1250, 1255, 1263, 1271-1273, 1290-1292, 1300-1302, 1310-1312, 1322-1325, 1333-1335 and 1345.  A third failure to break the down trend line on the weekly chart confirms that the intermediate down trend is intact, however the recent trading suggests the bulls may be building a base for a rally.

Today's video for subscribers looks at the recent trading in more detail and our strategy for today's trading session.


0 Comments

    Old Posts

    August 2021
    July 2021
    June 2021
    May 2021
    March 2021
    February 2021
    January 2021
    December 2020
    November 2020
    March 2019
    January 2019
    December 2018
    October 2018
    September 2018
    August 2018
    July 2018
    June 2018
    May 2018
    March 2018
    February 2018
    July 2017
    June 2017
    May 2017
    April 2017
    March 2017
    February 2017
    January 2017
    December 2016
    July 2016
    March 2016
    December 2015
    November 2015
    October 2015
    September 2015
    August 2015
    July 2015
    June 2015
    May 2015
    April 2015
    March 2015
    February 2015
    January 2015
    December 2014
    November 2014
    October 2014
    September 2014
    August 2014
    July 2014
    June 2014
    May 2014
    April 2014
    March 2014
    February 2014
    January 2014
    December 2013
    November 2013
    October 2013
    September 2013
    August 2013
    July 2013
    June 2013
    May 2013
    April 2013
    March 2013
    February 2013
    January 2013
    December 2012
    November 2012
    October 2012
    September 2012
    August 2012
    July 2012
    June 2012
    May 2012
    April 2012
    March 2012
    February 2012
    January 2012
    December 2011
    November 2011
    October 2011

UK Gold Trading Experts (UKGTE) is a trading name of Drupac Limited, a company registered in England and Wales (company number 09167819) whose registered office is 1 St. Paul's Square, Birmingham, B3 1QU.