UK Gold Trading Experts
  • Home
  • Trade Like a Pro
  • Gold Blog
  • Subscriber Resources
  • Legal Stuff
    • User Agreement
  • Contact Us

Gold Market Update - 30th Dec

30/12/2014

0 Comments

 
LONG TERM TREND:                  BEARISH
INTERMEDIATE TERM TREND:     BEARISH/NEUTRAL
SHORT TERM TREND:                NEUTRAL
VERY SHORT TERM TREND:        NEUTRAL

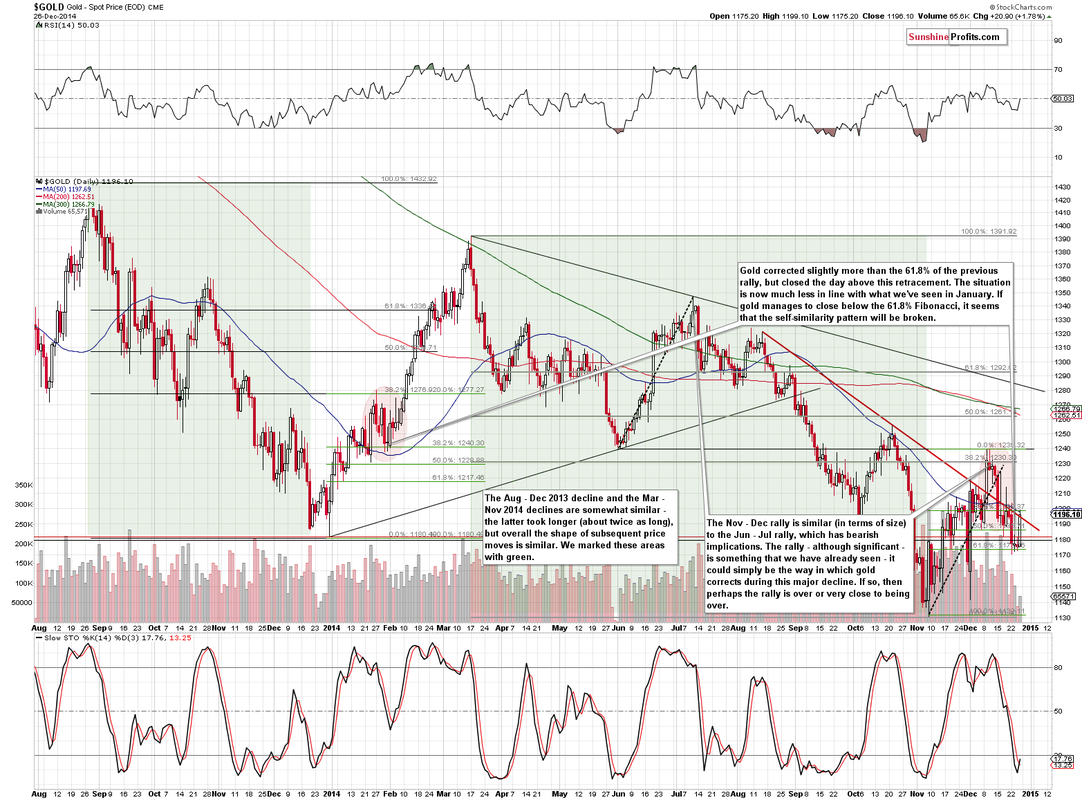
As we mentioned in our previous blog, gold has settled into a range oscillating around 1200 for the remainder of the year.

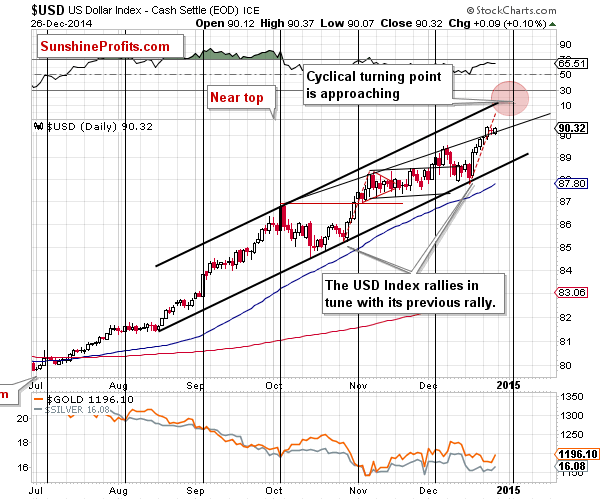
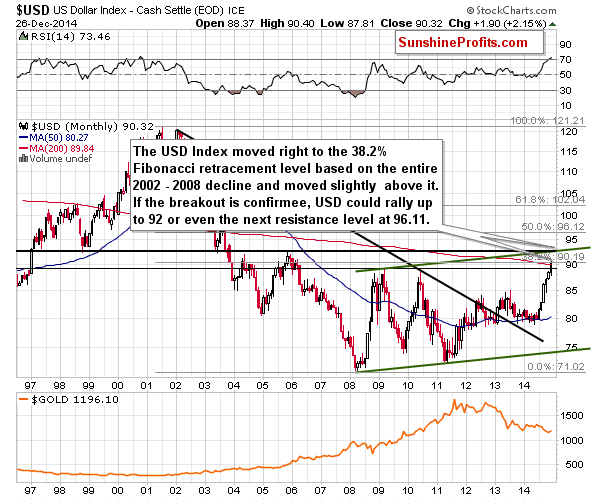
The outlook for 2015 appears weak for gold, with equities at all time highs, the dollar powering higher above 90 and at multi-year highs and oil continuing its precitpitous fall that has been the talk of the last quarter of 2014.

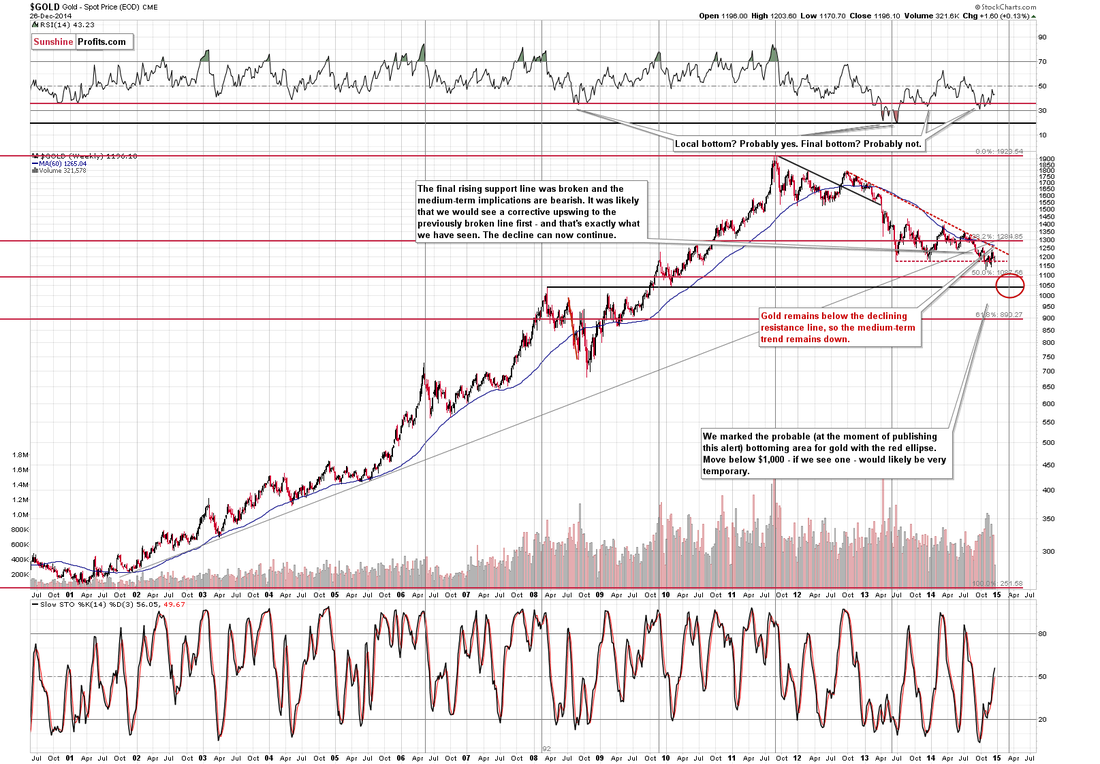
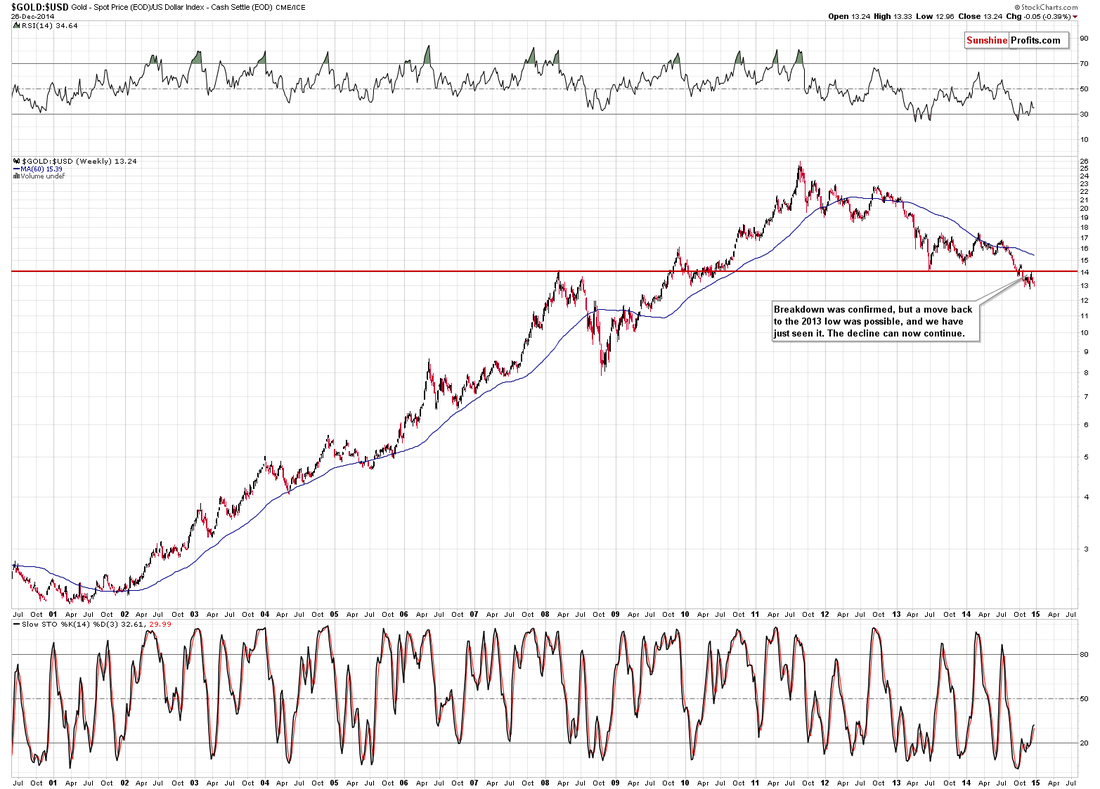
We will be watching for a break below 1131 early next year to confirm our long term 1000 target, with the bulls needing to break 1245 to reverse the downtrend.  Longer term, a slew of moving averages below 1300 will provide stiff resistance should gold break this initial target.

Support can be found at 1180-1183, 1175-1178, 1154, 1145-1147, 1131, 1124, 1100, 1085, 1045 and 1000 . Gold has bounced back and appears to be building a base to move higher after breaching the critical 1180 level, in what looks to be a classic "bear trap".

Resistance can be found at 1192, 1198, 1203, 1207, 1213, 1222-1223, 1235-1238, 1250, 1255, 1263, 1271-1273, 1290-1292, 1300-1302, 1310-1312, 1322-1325, 1333-1335 and 1345.  A second failure to break through the key 65 week MA confirms that the intermediate down trend is intact however the recent trading suggests the bulls may be building a base for a rally.

Today's video for subscribers looks at the recent trading in more detail and our strategy for today's trading session.

0 Comments

Gold & Silver Trading Alert: Gold Rallies With USD Above 90

30/12/2014

0 Comments

 
Gold & Silver Trading Alert originally published on December 29th, 2014 7:17 AM: 

Briefly: In our opinion no speculative short positions in gold, silver and mining stocks are currently justified from the risk/reward perspective. 

The USD Index moved slightly above the key, long-term resistance level but gold rallied by almost $20 on Friday. We have seen several bearish signs in the precious metals market recently – is the above bullish enough to make the overall outlook for the precious metals market bullish? 

Not really. Gold didn’t move above the previous resistance levels, so actually not much changed and most of what we wrote last week remains up-to-date. Let’s start today’s analysis with the USD Index (charts courtesy of http://stockcharts.com).
Picture
In the previous alert we wrote the following:

The USD Index moved higher only insignificantly, and we don’t see much change on the short-term chart. One could argue whether there was a short-term breakout or not, but even if we agree that there indeed was one, it’s not confirmed. Consequently, the short-term picture doesn’t provide us with much new information. 

The USD Index closed the week above 90 and also above the rising short-term resistance line, so the short-term breakout is confirmed. The implications for the next several days are bullish. 

Let’s take a look at the situation in the USD Index from the very long-term perspective.
Picture
In the previous alert we wrote the following: 

The USD Index has just encountered a major resistance line that it needs to surpass before a rally to 92 becomes very probable – the 38.2% Fibonacci retracement levels based on the entire 2002 – 2008 decline. 

The Fibonacci retracements have worked for the USD Index many times in the past, so it could be the case that this level will keep the rally in check for some time. If not, and we see a confirmed breakout, then we’ll likely see another big rally – to the 92 level or perhaps even to the next retracement at 96.11. 

However, we would first need to see the breakout and its confirmation. For now, we have just seen a move to this critical level. While the situation in the precious metals market remains bearish, without a breakout in the USD Index, the possibility of another slide in the USD and a rally in gold, silver and mining stocks will be too big for us to think that opening short positions in the precious metals sector is justified from the risk to reward perspective. 

The USD Index closed the week above the critical resistance level (the 38.2% Fibonacci retracement level), but it closed only a little above it and for just one day, so the breakout is not confirmed at this time. Consequently, we don’t think that the move to 92 or higher is very probable for the USD Index at present. The implications for the precious metals market remain rather unclear at this time.
Picture
The long-term picture for gold remains unchanged. Last week’s events didn’t change much as gold ended the week below $1,200 and well below the declining resistance line. The medium-term trend remains down.
Picture
The short-term price action didn’t change much either. The previously-mentioned self-similar pattern could still be in place – the current situation is still somewhat similar to what we saw in January 2014. This means that based on the above chart alone we could see a rally in the coming days.  

Please note that gold rallied on very low volume, but that was a low-volume session across the board due to the Holiday season. Consequently, while low-volume rally would be a bearish sign in normal case, at this time there are no such implications. 

Moreover, there was a buy signal from the Stochastic indicator, which of course is a bullish sign, but on the other hand, there was no breakout above the declining red resistance line.  

Overall, the above chart is more bullish than it was last week, but not bullish enough to justify opening long positions based just on it.
Picture
When we take a look at the gold market from the gold to USD Index ratio perspective, we’ll see that the recent really was nothing more than a verification of a breakdown below the 2013 low and 2008 high. With this breakdown being confirmed, we can expect to see a move lower shortly.
Picture
The silver market moved higher in the last session and we saw a breakout, but let’s not forget that “breakouts” in silver have very often turned out to be “fakeouts” and followed by sharp declines. The most recent example took place at the beginning of December. Overall, the breakout in silver has no bullish implications in our opinion.
Picture
Gold stocks and silver stocks (the XAU Index includes both) didn’t move much lower last week, but they didn’t move much higher either. Overall, the last few weeks of trading seem to be simply a pause within a big decline. If the move that follows the current consolidation is similar to the one that preceded it, we could actually see mining stocks at their 2000 lows. 

Could we really see such a significant decline in the mining stocks sector? Why not, it would be less than half of what the miners have already declined since 2010. Besides, the entire commodity sector could move even lower.
Picture
The CCI Index (proxy for the commodity sector) has definitely broken and verified the breakdown below important support levels: the rising very long-term support line, the declining long-term one, and the one based on the previous lows. The index has moved well below the 38.2% Fibonacci retracement based on the entire 2001 – 2011 bull market. It’s now likely to decline to the 50% or even the 61.8% retracement. The latter seems even more likely as that’s where the commodities declined in 2008 (back then the retracement was based on the 2008 top) – the CCI Index even moved a bit below this level and then started to rally once again. 

Overall, the situation is still unclear as there are several factors that point to a looming decline in the precious metals, but there are also some important signs suggesting higher values of PMs – like the critical resistance in the USD Index.  

It seems that another trading opportunity is just around the corner and even though not much seems to be going on, it might be that paying close attention to the precious metals market at this time and in the coming days will be well worth it. It might be the case that the USD Index manages to rally shortly and confirms the breakout above its key resistance. If that takes place, it will likely create a great entry point for short positions in the precious metals market. However, we are not at that point yet and other factors will need to be considered as well. As always, we'll keep our subscribers updated should our views on the market change. We will continue to send them our Gold & Silver Trading Alerts on each trading day and we will send additional ones whenever appropriate. If you'd like to receive them, please subscribe today or sign up for our free mailing list today. 

To summarize: 

Trading capital (our opinion): No positions 

Long-term capital (our opinion): No positions 

Insurance capital (our opinion): Full position 

You will find details on our thoughts on gold portfolio structuring in the Key Insights section on our website. 

Thank you. 

Przemyslaw Radomski, CFA

Founder, Editor-in-chief

Tools for Effective Gold & Silver Investments - SunshineProfits.com

Tools für Effektives Gold- und Silber-Investment - SunshineProfits.DE


* * * * *
Disclaimer
All essays, research and information found above represent analyses and opinions of Przemyslaw Radomski, CFA and Sunshine Profits' associates only. As such, it may prove wrong and be a subject to change without notice. Opinions and analyses were based on data available to authors of respective essays at the time of writing. Although the information provided above is based on careful research and sources that are believed to be accurate, Przemyslaw Radomski, CFA and his associates do not guarantee the accuracy or thoroughness of the data or information reported. The opinions published above are neither an offer nor a recommendation to purchase or sell any securities. Mr. Radomski is not a Registered Securities Advisor. By reading Przemyslaw Radomski's, CFA reports you fully agree that he will not be held responsible or liable for any decisions you make regarding any information provided in these reports. Investing, trading and speculation in any financial markets may involve high risk of loss. Przemyslaw Radomski, CFA, Sunshine Profits' employees and affiliates as well as members of their families may have a short or long position in any securities, including those mentioned in any of the reports or essays, and may make additional purchases and/or sales of those securities without notice.
0 Comments

Gold Market Update - 22nd Dec

22/12/2014

0 Comments

 
LONG TERM TREND:                   BEARISH
INTERMEDIATE TERM TREND:    BEARISH/NEUTRAL
SHORT TERM TREND:                 NEUTRAL
VERY SHORT TERM TREND:       NEUTRAL

Gold appears to have settled into a range oscillating around 1200 for the remainder of the year, with trading volumes dropping off as we approach Christmas.  Gold has barely made any progress this year, moving in a 250 point range for the year with a high of 1388 and a low of 1131 and likely to close very near to where it started the year.  

Considering the chart position as we entered 2014, this must be seen as a good result for the bulls who managed to hold 1180 for most of the year, quickly reclaiming it when this critical resistance point fell in October.

However, the headwinds that have buffered gold all year (strong equities and dollar, weak oil) remain in place - interest rate rises look a long way off and inflation is nowhere to be seen.  Geopolitical tensions remain, as ever, and European troubles continue to loom over the markets like a sword of Damocles.

Next year we suspect gold will be in for a torrid time, with the price moving lower and our long term target of 100-1050 being reached.  The longer term prospects depend greatly on how equities and the dollar fare, in particular whether the global recovery can continue or falter.

Support can be found at 1193, 1187, 1180-1183, 1175-1178, 1154, 1145-1147, 1131, 1124, 1100, 1085, 1045 and 1000 . Gold has bounced back and appears to be building a base to move higher after breaching the critical 1180 level, in what looks to be a classic "bear trap".

Resistance can be found at 1203, 1207, 1213, 1222-1223, 1235-1238, 1250, 1255, 1263, 1271-1273, 1290-1292, 1300-1302, 1310-1312, 1322-1325, 1333-1335 and 1345.  A second failure to break through the key 65 week MA confirms that the intermediate down trend is intact however the recent trading suggests the bulls may be building a base for a rally.

Today's video for subscribers looks at the recent trading in more detail and our strategy for today's trading session.
0 Comments

Gold Market Update - 17th Dec

17/12/2014

0 Comments

 
LONG TERM TREND:                   BEARISH
INTERMEDIATE TERM TREND:    BEARISH/NEUTRAL
SHORT TERM TREND:                 NEUTRAL
VERY SHORT TERM TREND:       BEARISH

The "bull flag" pattern that appeared to be forming earlier in the week broke down on Monday in spectacular fashion, with gold tumbling as low as 1190 before finding support.

Yesterday, gold took traders on a wild ride, as Russian currency difficulties resulting from economic sanctions and a plunging oil price provided high levels of volatility to all sorts of markets.  At one point gold was trading as high as 1223 before tumbling to 1187 following a surge in equity markets, eventually closing at 1197.

The short term price direction is unclear, with both bulls and bears seeing reasons to be hopeful, however the choppy nature of the recent rally and another rejection of the long term down trend line on the weekly chart suggests to us that the bears remain in the driving seat.

However, there are also some signs that a bottom has been put in at 1131 with the break below 1180 a classic "bear trap" - a break above 1220 would confirm the bullish case as the more likely outcome whilst a break below 1180 would suggest the bears remain in control.

Support can be found at 1191, 1187, 1180-1183, 1175-1178, 1154, 1145-1147, 1131, 1124, 1100, 1085, 1045 and 1000 . Gold has bounced back and appears to be building a base to move higher after breaching the critical 1180 level, in what looks to be a classic "bear trap".

Resistance can be found at 1207, 1222-1223, 1235-1238, 1250, 1255, 1263, 1271-1273, 1290-1292, 1300-1302, 1310-1312, 1322-1325, 1333-1335 and 1345.  A second failure to break through the key 65 week MA confirms that the intermediate down trend is intact however the recent trading suggests the bulls may be building a base for a rally.

Today's video for subscribers looks at the recent trading in more detail and our strategy for today's trading session.
0 Comments

Gold Market Update - 15th Dec

15/12/2014

0 Comments

 
LONG TERM TREND:                   BEARISH
INTERMEDIATE TERM TREND:    BEARISH/NEUTRAL
SHORT TERM TREND:                 BULLISH
VERY SHORT TERM TREND:       NEUTRAL

Since hitting a high of 1238 last week, gold has drifted lower in a "bull flag" pattern, finding support at 1210.  The price remains above both the 20 DMA and 50 DMA which have turned upwards, suggesting a change in the short term trend is underway.

The weekly chart shows gold is yet again attempting to break the long term downtrend line, currently at 1206 with a confluence of moving averages just above this level providing strong resistance.  If gold can manage to break through these moving averages, a target of 1300 comes into play.

Equities have tumbled over 4% in the past week or so, helping boost gold's appeal, however the dollar has remained strong and is near to multi-year highs.  Oil has collapsed to a low of $57 a barrel, a level almost unthinkable just a few months ago, however this morning the price is rebounding slightly.

Support can be found at 1209, 1200, 1191, 1186, 1180-1183, 1175-1178, 1154, 1145-1147, 1131, 1124, 1100, 1085, 1045 and 1000 . Gold has bounced back and appears to be building a base to move higher after breaching the critical 1180 level, in what looks to be a classic "bear trap".

Resistance can be found at 1222, 1235-1238, 1250, 1255, 1263, 1271-1273, 1290-1292, 1300-1302, 1310-1312, 1322-1325, 1333-1335 and 1345.  A second failure to break through the key 65 week MA confirms that the intermediate down trend is intact however the recent trading suggests the bulls may be building a base for a rally.

Today's video for subscribers looks at the recent trading in more detail and our strategy for today's trading session.
0 Comments

Gold Market Update - 11th Dec

11/12/2014

0 Comments

 
LONG TERM TREND:                  BEARISH
INTERMEDIATE TERM TREND:    BEARISH/NEUTRAL
SHORT TERM TREND:                BULLISH
VERY SHORT TERM TREND:       NEUTRAL

Gold hit a new rally high of 1238 near the 100 DMA on Tuesday, forming a "double top" at that level yesterday.  The price has since fallen back to retest the uptrend channel line at 1217 and there is a potential "three river evening star" candlestick pattern forming on the daily chart.

This would be a bearish development and suggest the recent rally was a short lived reaction to falling equity markets and that the intermediate bear market remains intact.  However, a bounce from these levels and a close above 1220 on a weekly basis would suggest the rally still has more to go.

The equity markets are bouncing this morning after sharp falls due to Chinese markets tumbling and fears of a Greek exit form the Euro looming back into the foreground yet again.  The fact that this bounce is coinciding with a fall in gold is troubling for the bulls and suggests that the bearish scenario above may be playing out.

The dollar rally shows no sign of slowing - with the Euro under pressure due to Greece and its internal problems, the Japanese Yen cratering due to the massive QE expansion programme and the British Pound suffering form proximity to Europe, the dollar is the only show in town.

Support can be found at 1217, 1208, 1200, 1191, 1186, 1180-1183, 1175-1178, 1154, 1145-1147, 1131, 1124, 1100, 1085, 1045 and 1000 . Although the break of 1180 has serious bearish implications for gold and suggests a decline to 1000-1050 in the short term, gold has bounced back and appears to be building a base to move higher.

Resistance can be found at 1222, 1235-1238, 1250, 1255, 1263, 1271-1273, 1290-1292, 1300-1302, 1310-1312, 1322-1325, 1333-1335 and 1345.  A second failure to break through the key 65 week MA confirms that the intermediate down trend is intact however the recent trading suggests the bulls may be building a base for a rally.

Today's video for subscribers looks at the recent trading in more detail and our strategy for today's trading session.
0 Comments

Gold Market Update - 9th Dec

9/12/2014

0 Comments

 
LONG TERM TREND:                  BEARISH
INTERMEDIATE TERM TREND:    BEARISH/NEUTRAL
SHORT TERM TREND:                BULLISH
VERY SHORT TERM TREND:      BULLISH


Whilst the well established down trend is still in play, gold is showing definite signs of bottoming, with a higher low at 1143 last week followed by a powerful surge to 1222 potentially the beginning of a new uptrend.  Gold appears to be forming a "bull flag" on the daily chart that would suggest a rally to 1265 is imminent.

This would break the intermediate term down trend decisively and confirm the intermediate term bottom at 1131, however there is a lot of resistance above the current price. 
The price has bounced off the 20 DMA and broken through the 50 DMA in the last couple of days, though the 61.8% retracement level at 1208 has so far contained the price and the down trend channel currently sits at 1213.

The dollar and equities continue to rally strongly, whilst oil has fallen to new multi year lows over the past couple of trading sessions.  Whilst this fundamental environment is clearly bearish for gold, the technical picture is much more positive, as outlined above.

Support can be found at 1200, 1191, 1186, 1180-1183, 1175-1178, 1154, 1145-1147, 1131, 1124, 1100, 1085, 1045 and 1000 . Although the break of 1180 has serious bearish implications for gold and suggests a decline to 1000-1050 in the short term, gold has bounced back and appears to be building a base to move higher.

Resistance can be found at 1208, 1222, 1225, 1235, 1250, 1255, 1263, 1271-1273, 1290-1292, 1300-1302, 1310-1312, 1322-1325, 1333-1335 and 1345.  A second failure to break through the key 65 week MA confirms that the intermediate down trend is intact however the recent trading suggests the bulls may be building a base for a rally.

Today's video for subscribers looks at the recent trading in more detail and our strategy for today's trading session.
0 Comments

Gold Market Update - 4th Dec

4/12/2014

0 Comments

 
LONG TERM TREND:                  BEARISH
INTERMEDIATE TERM TREND:    BEARISH/NEUTRAL
SHORT TERM TREND:                BULLISH
VERY SHORT TERM TREND:      BULLISH

After surging higher and hitting a high of 1222 on Friday, gold has consolidated around the 1200 level.  It is unclear whether this move is the start of a significant new rally leg or a counter trend move within the well established down trend.  A break of 1222 would suggest the former and a break below 1193 would suggest the latter.

The down trend channel has so far contained the price, with the 61.8% Fib retracement level providing further resistance - the market has managed to break above the 50 DMA and the 20 DMA has curled upwards.  The 50% Fib retracement level is providing support at 1193.

Equities remain well supported, as does the dollar which continues to make new highs.  Oil will be closely watched - the tumbling oil price has dispelled any lingering notions of inflation and interest rate rises, with further falls likely to impact gold negatively.

Support can be found at 1200, 1193, 1188, 1180-1183, 1175-1178, 1154, 1145-1147, 1131, 1124, 1100, 1085, 1045 and 1000 . The break of 1180 has serious bearish implications for gold and suggests a decline to 1000-1050 in the short term, unless gold can hold above this level and build a base to move higher.

Resistance can be found at 1205, 1208, 1222, 1225, 1235, 1250, 1255, 1263, 1271-1273, 1290-1292, 1300-1302, 1310-1312, 1322-1325, 1333-1335 and 1345.  A second failure to break through the key 65 week MA confirms that the intermediate down trend is intact and the break of 1180 suggests the bears are in full control.

Today's video for subscribers looks at the recent trading in more detail and our strategy for today's trading session.
0 Comments

Gold Market Update - 2nd Dec

2/12/2014

0 Comments

 
LONG TERM TREND:                  BEARISH
INTERMEDIATE TERM TREND:    BEARISH/NEUTRAL
SHORT TERM TREND:                BULLISH
VERY SHORT TERM TREND:      BULLISH

Gold gapped down at the open on Sunday, tumbling as low as 1143 and looking in real trouble, however the bulls swooped in at these levels, propelling gold much higher, smashing resistance levels to peak at 1220, some $80 higher than the lows.

This incredible turn around after a very bearish open suggests a change of trend of some significance could be developing - the break above last week's high at 1207, particularly with an important "bullish engulfing" candlestick developing on the weekly chart, is a very positive move.  However, gold has retreated back below 1200 this morning, putting the bullish case in doubt.  A close above 1178 on the weekly chart would be very constructive for the bulls and suggest a move back towards 1300 was likely.

The oil price is still an important driver for gold - any resumption of the down trend in oil will drag gold down, as will further equity and dollar strength.

Support can be found at 1193, 1188, 1180-1183, 1175-1178, 1154, 1145-1147, 1131, 1124, 1100, 1085, 1045 and 1000 . The break of 1180 has serious bearish implications for gold and suggests a decline to 1000-1050 in the short term, unless gold can hold above this level and build a base to move higher.

Resistance can be found at 1205, 1208, 1222, 1225, 1235, 1250, 1255, 1263, 1271-1273, 1290-1292, 1300-1302, 1310-1312, 1322-1325, 1333-1335 and 1345.  A second failure to break through the key 65 week MA confirms that the intermediate down trend is intact and the break of 1180 suggests the bears are in full control.

Today's video for subscribers looks at the recent trading in more detail and our strategy for today's trading session.
0 Comments

    Old Posts

    August 2021
    July 2021
    June 2021
    May 2021
    March 2021
    February 2021
    January 2021
    December 2020
    November 2020
    March 2019
    January 2019
    December 2018
    October 2018
    September 2018
    August 2018
    July 2018
    June 2018
    May 2018
    March 2018
    February 2018
    July 2017
    June 2017
    May 2017
    April 2017
    March 2017
    February 2017
    January 2017
    December 2016
    July 2016
    March 2016
    December 2015
    November 2015
    October 2015
    September 2015
    August 2015
    July 2015
    June 2015
    May 2015
    April 2015
    March 2015
    February 2015
    January 2015
    December 2014
    November 2014
    October 2014
    September 2014
    August 2014
    July 2014
    June 2014
    May 2014
    April 2014
    March 2014
    February 2014
    January 2014
    December 2013
    November 2013
    October 2013
    September 2013
    August 2013
    July 2013
    June 2013
    May 2013
    April 2013
    March 2013
    February 2013
    January 2013
    December 2012
    November 2012
    October 2012
    September 2012
    August 2012
    July 2012
    June 2012
    May 2012
    April 2012
    March 2012
    February 2012
    January 2012
    December 2011
    November 2011
    October 2011

UK Gold Trading Experts (UKGTE) is a trading name of Drupac Limited, a company registered in England and Wales (company number 09167819) whose registered office is 1 St. Paul's Square, Birmingham, B3 1QU.