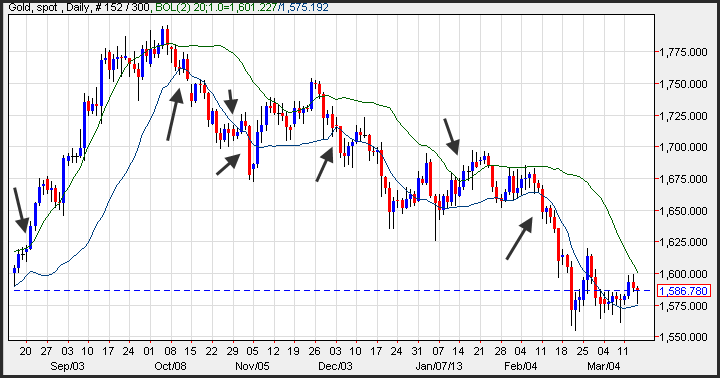
The gold market is a technical market meaning that many of the short term movements of the yellow metal are driven by price action. The best way to determine the future short term direction of gold prices is to use specific types of techniques that will give you the edge over other traders. Trading a range or using a specific breakout method can help a trader pinpoint an entry point to initiate a gold position using derivatives instruments such as CFDs, spread bets or binary options.
There are a number of technical analysis techniques including breakout strategies using ranges as well as triangles which are patterns that will give a gold trader an edge if recognised.
In general gold prices over the long term find a specific direction which will continue to perpetuate over a long period of time. In the short term, markets move from a consolidative tone to a trend environment back in to a consolidative pattern as investors attempt to jockey for position prior to the next market move.
Ranges
There are a number of ways to manage risk using this range breakout system. Some take profit using the moving average, while others look to take profit over a reversal signal.
Triangles
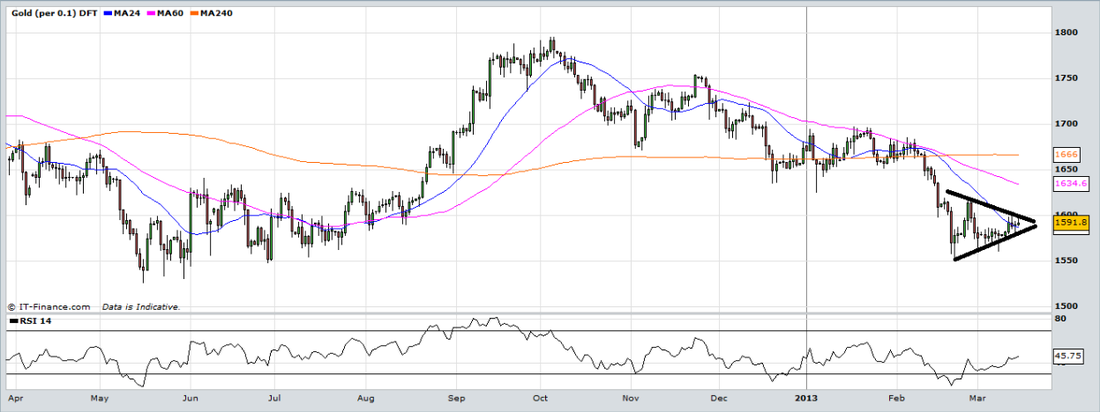
Symmetrical triangles are price action that reflects the psychology of indecision. Gold trader’s attempts to push prices higher are quickly met by selling, while drops are seen as buying opportunities. The consolidative tone creates shape of a sideways triangle. Once gold prices break out, the price action is accompanied by increases in volume.
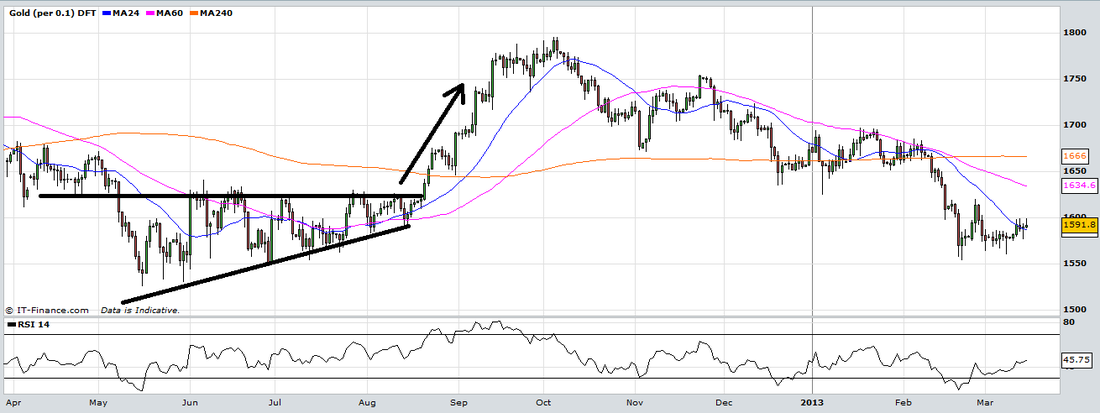
The ascending triangle is a variation of the symmetrical triangle. Ascending triangles are generally considered bullish and are most reliable when found in an uptrend. The top part of the triangle appears flat, while the bottom part of the triangle has an upward slant. Prices usually break through the old highs in an ascending triangle and are accompanied by an increase in volume.
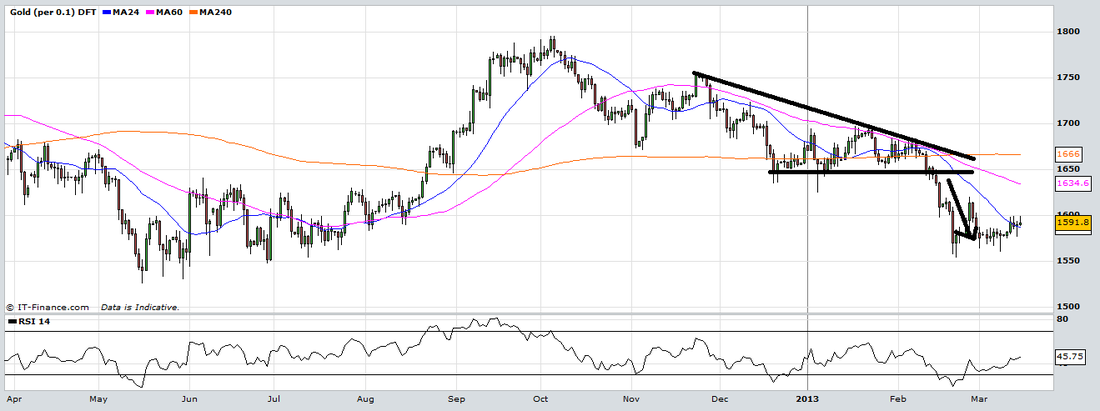
The descending triangle is also a variation. The descending triangle generally is a bearish pattern and often occurs during a downtrend. In the descending triangle the bottom part of the triangle appears flat. When the market breaks lower it is accompanied by increases in volume.


