
Good morning Subscribers,
Another winner yesterday – a quick “in and out” for 50 points. Let’s take a quick step through…this case provides a great example of how we use information from multiple timeframes to set up a winning trade, in this instance with signals from the 4-hour chart all the way down to an expertly timed entry from the 1-minute chart.
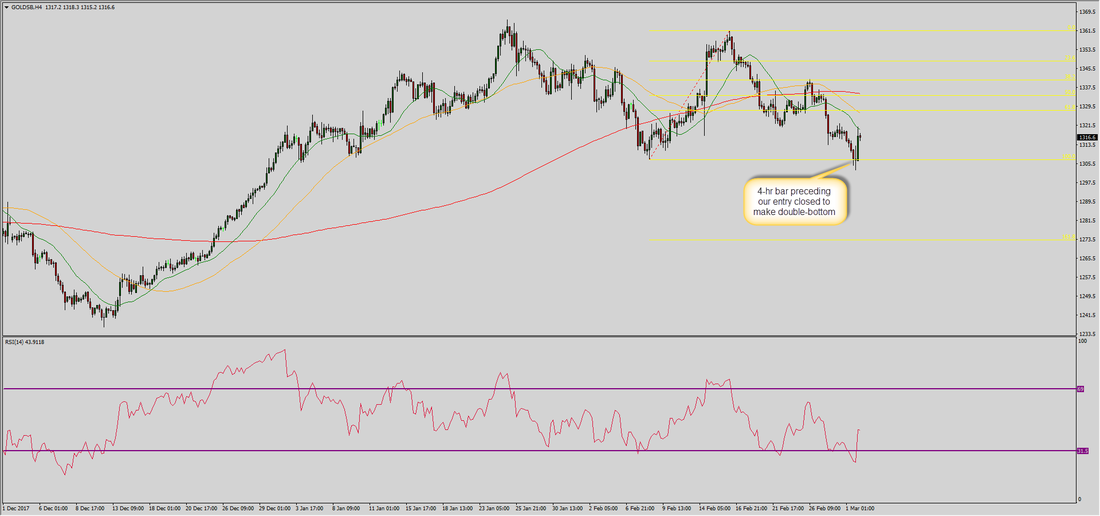
The first chart below is the 4-hour. Our trade was triggered at 17:21 GKFX time (2hrs ahead of the UK) – notice on this chart where the 13:00 4hr bar closed…right on the line of the 100% fib retracement level, effectively making a double-bottom with the low on 8th Feb. Because this is on the 4-hour, it will weigh heavily on the lower timeframes. Also notice RSI is oversold. So we’re now expecting some sort of bounce. It’s also worth noting the proximity to the 1300 level…round numbers such as these tend to form natural support & resistance levels. Again, another clue that a bounce is due.
Another winner yesterday – a quick “in and out” for 50 points. Let’s take a quick step through…this case provides a great example of how we use information from multiple timeframes to set up a winning trade, in this instance with signals from the 4-hour chart all the way down to an expertly timed entry from the 1-minute chart.
The first chart below is the 4-hour. Our trade was triggered at 17:21 GKFX time (2hrs ahead of the UK) – notice on this chart where the 13:00 4hr bar closed…right on the line of the 100% fib retracement level, effectively making a double-bottom with the low on 8th Feb. Because this is on the 4-hour, it will weigh heavily on the lower timeframes. Also notice RSI is oversold. So we’re now expecting some sort of bounce. It’s also worth noting the proximity to the 1300 level…round numbers such as these tend to form natural support & resistance levels. Again, another clue that a bounce is due.
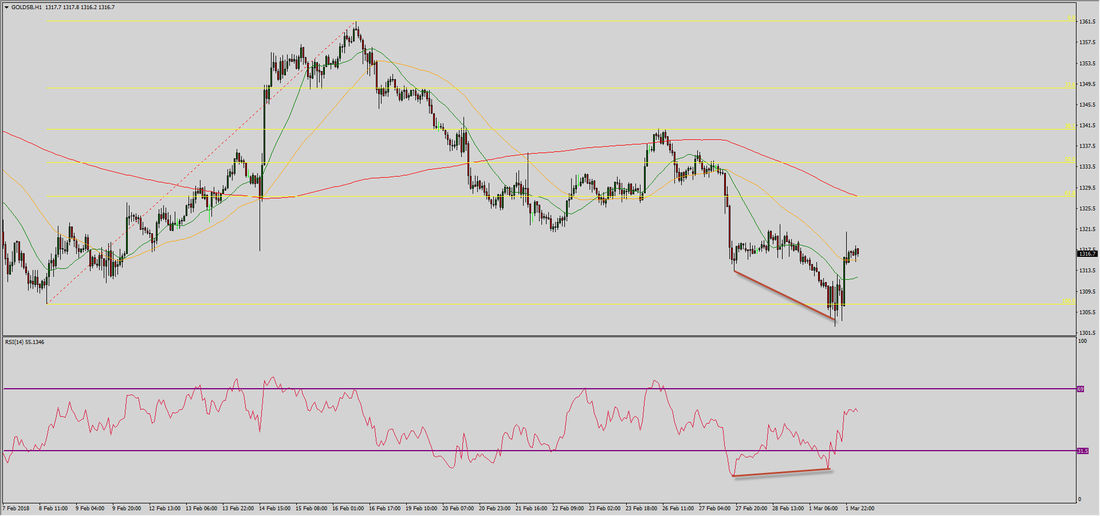
The next chart is the hourly. In the lead up to our entry there is very strong bullish RSI divergence, with some choppy price action in the 3 hours leading up to our trade.
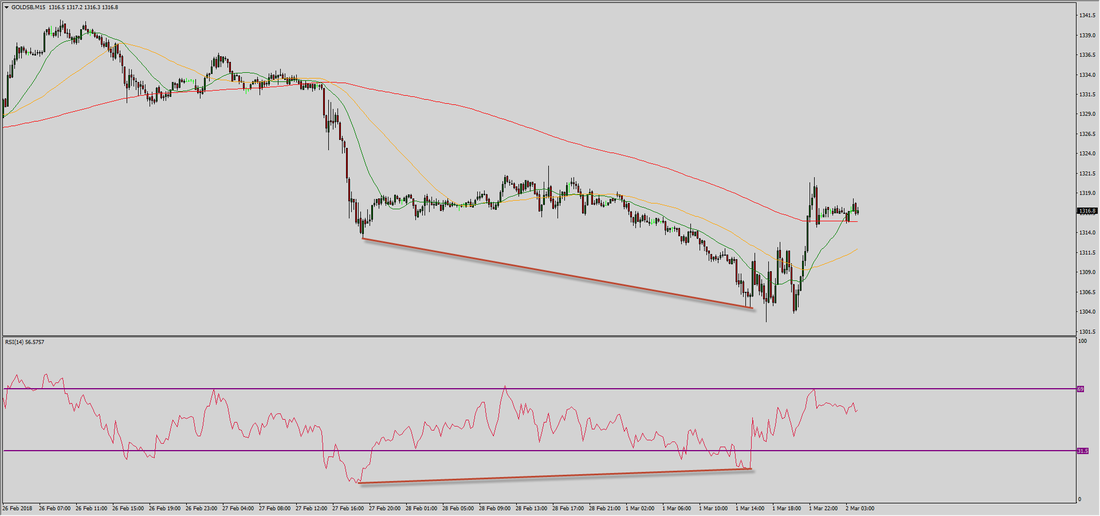
Similar again on the 15m chart below – bullish RSI divergence and then choppy price action near a strong support point from a higher timeframe (remember what we saw on the 4H) is a strong indicator that we’re going to see the reversal soon.
So far, our “clues” have been a clear area of support encountered on the 4H (double-bottom + 1300 natural support level), backed up by strong bullish RSI divergence on the 1H and 15m charts. In these scenarios where there are multiple indicators from higher timeframes weighing down we tend to look to the very short timeframe charts such as the 5m or even the 1m to get our trigger...which was the case here.
The next two charts are the 5m and 1m
On the 5m below, notice how prior to our entry there is very short-term bullish RSI divergence. Price rallies, but it’s not very strong and soon collapses back to around 1305. This has lifted RSI higher and so sets up the potential for a continuation of that divergence if price makes a lower low. We were waiting for that to form to enter.
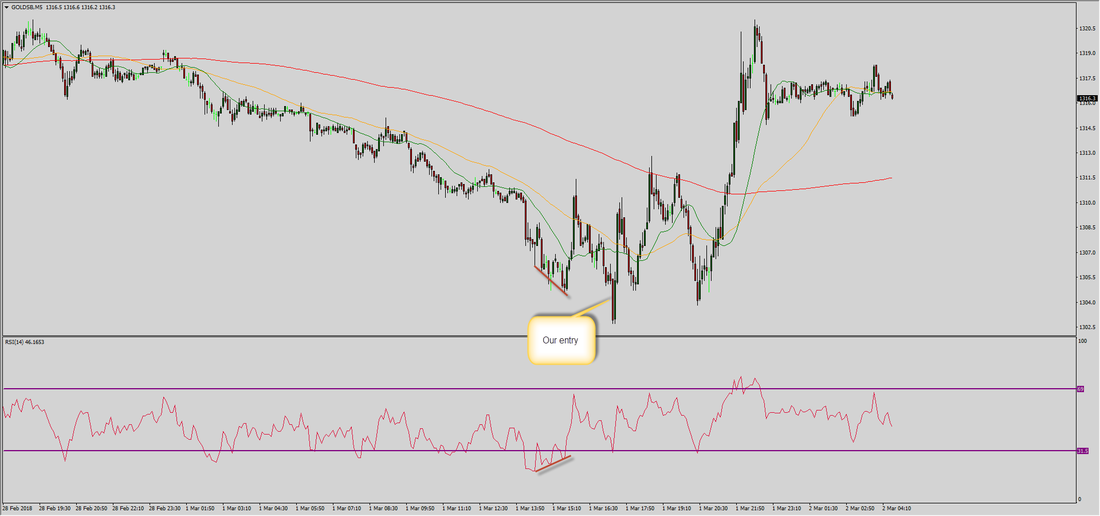
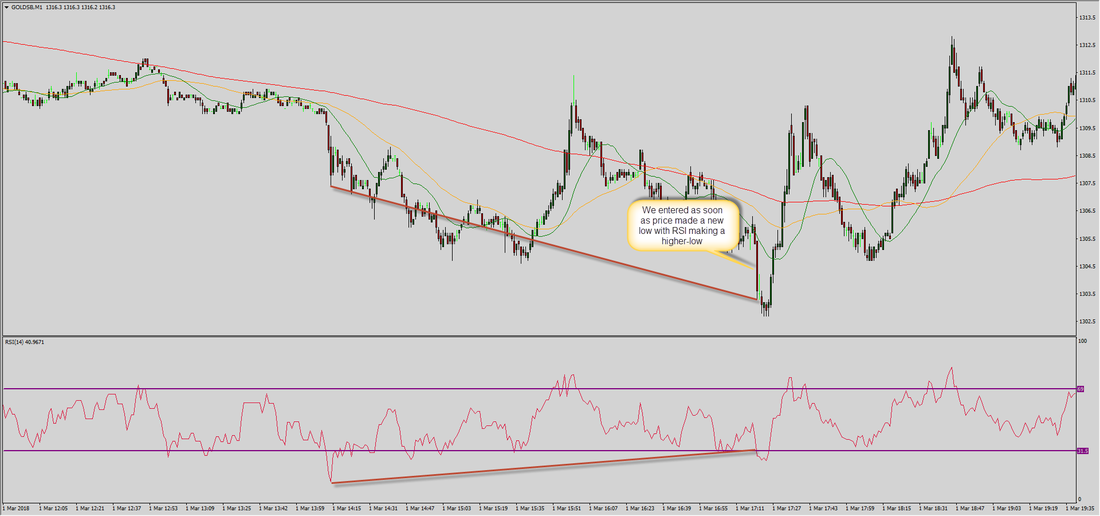
On the 1m chart below you can see the same pattern – bullish RSI divergence from around 14:15 followed by a short rally. We’ve marked our entry on the close of the 17:20 candle…as soon as price broke below the previous lows but posted an RSI low higher than previous lows we knew that it would lead to a continuation of the RSI divergence on the higher timeframe and so was a great place to take an entry a little bit ahead of anyone else.
Another solid win and a great start to March after a profitable February.
Thank you, as always, for following us! We’re currently flat, waiting for our next set up.
Thank you, as always, for following us! We’re currently flat, waiting for our next set up.