It is clear to us that, at present, the future direction of the gold market (as well as other precious metals and equities) is almost entirely dependent on whether further stimulus is provided by the central banks of the world - most notable by the Federal Reserve in the US.
To date the Fed has indicated that should economic conditions deteriorate they will use stimulus measures, including further quantitative easing, to boost the economy.
Consequently whenever we see weak economic data coming out of the US, markets rise in anticipation of further quantitative easing and strong data sees sharp sell offs. This strange scenario seems counterintuitive and in many respects it is, though this is the major driving force in the market at present and it would be folly to fight it.
Other fundamental factors supporting gold in the next quarter are the still unresolved difficulties of the EU, tensions with Iran and central bank buying of gold - particularly the Chinese where demand remains insatiable for the yellow metal.
However, we are technical traders and although the above fundamentals give us guidance for the general market direction we trade off the technical picture, using a combination of Elliot Wave counts, Fibonacci retracements and candlestick patterns.
The Technical Picture
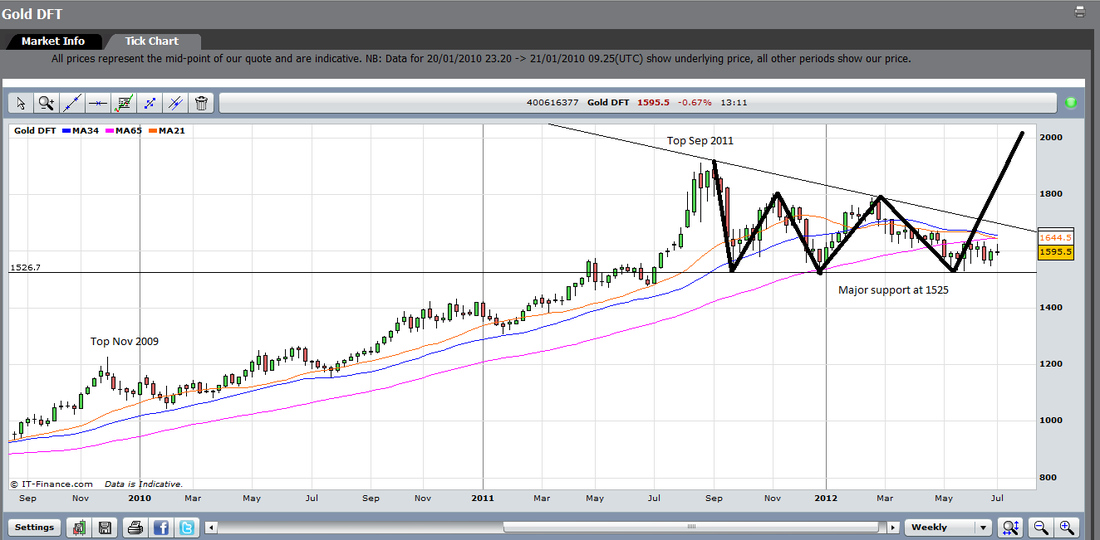
During this bull market the tops have been seen at regular 21 month intervals, meaning that we should see the next cyclical market top in June 2013. Since the last high in September 2011, gold has been correcting in a flat bottomed triangle, with 1525-1530 being major support and the downward sloping line currently around 1700.
This pattern has been unfolding over the past 9 months and will soon have to resolve itself, one way or the other, as we move towards the apex of the triangle.
We believe the triangle is a continuation pattern - the bull market is intact and prices will rise from here. The support zone from 1525-1550 is very strong, having been tested no less than 5 times since September and every time the price drops into this support zone, aggressive buying appears to lift it quickly out.
The long side of the market therefore offers an excellent risk:reward play - with good timing of the entry and a stop below 1525, little capital would be at risk for quite significant upside potential.
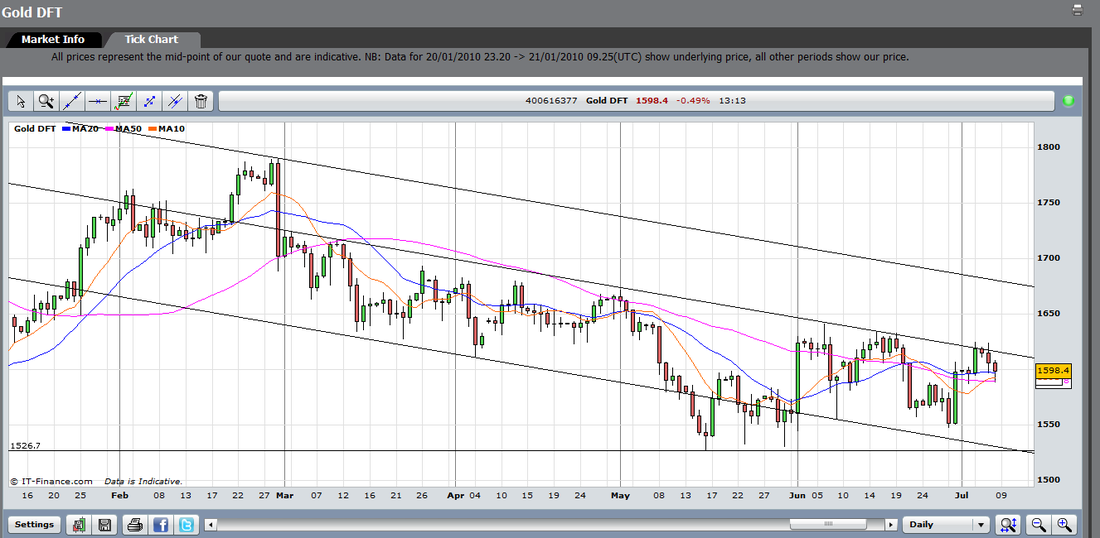
The next chart shows the intermediate downtrend that gold has been in since the huge sell off on 29 February 2012.
There will be a vast number of sell stops located just underneath this range and, should prices drop below this level, the market will crater lower and hit 1400 very quickly. We would expect a rapid bounce from this level as central banks fill their vaults with metal at this price.
So, the current set up offers an unusually clear strategy – go long with sell stops just below the support zone and be ready to reverse short if this level is breached. We expect the triangle to resolve to the upside in the coming months and a challenge to the highs above 1900 early next year, with a cycle top in June 2013.


