

Gold has been in a bull market for the last 12 years, with year on year gains in every calendar year since 2001. We believe that this bull market has a lot further to go, though we expect a top of some significance in 2013, year 13 of the rally, being a Fibonacci number.
After a correction, we then expect the gold price to move higher again in another multi-year rally, taking us to a major top in 2022, a 21 year super rally in precious metals the like of which the world has never seen before.
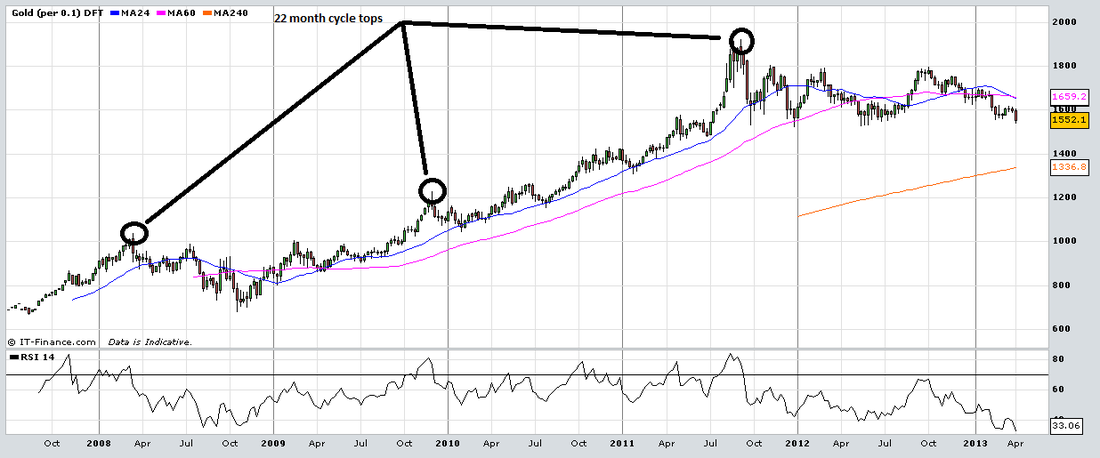
It is clear from the chart below that gold makes a cyclical top every 22 months. The last such major top was in September 2011, giving us our next cyclical top in July 2013.
After a correction, we then expect the gold price to move higher again in another multi-year rally, taking us to a major top in 2022, a 21 year super rally in precious metals the like of which the world has never seen before.
It is clear from the chart below that gold makes a cyclical top every 22 months. The last such major top was in September 2011, giving us our next cyclical top in July 2013.
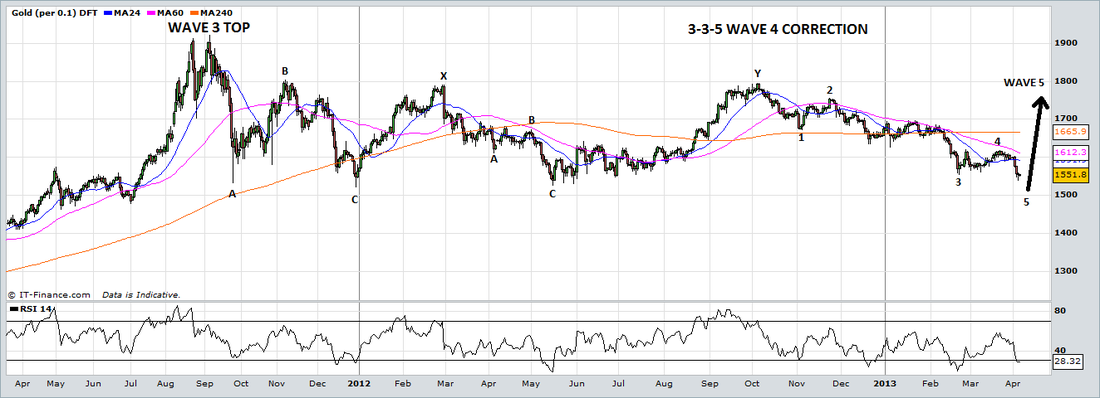
From an Elliot Wave perspective, we are in a Wave 4 corrective pattern following the Wave 3 top in September 2011.
It is now clear, after 18 months of corrective action in gold, that the Wave 4 pattern is a complex 3-3-5 correction, made up of two linked ABC corrections together with a final 5 wave impulse decline.
We are approaching the end of the final 5 wave decline, our best guess is that we have just started Wave v of 5, the final decline. The chart below sets out this Elliott Wave count in detail.
This means that we still have a major Wave 5 rally to complete the pattern, with the first impulse move of this 5th Wave to take us to the cyclical high in July 2013.
After finally making a bottom, we expect the price to move sharply higher over the next 4 months to arrive at our projected top in July 2013 at around $1,900, potentially forming a large “double top” on the charts.
We then expect a correction to unfold in gold and silver, taking gold prices back to $1,700-$1,750 before the next major rally begins, Wave 3 of 5, taking gold far beyond $2,000 in the next few years.
It is often the case that Wave 5 in a commodities rally will be the strongest and most powerful wave, lasting longer than even Wave 3 and often extending to a more complex 7 wave structure.
Keep up to date with our market analysis by visiting the gold trading blog daily. If you are an active gold trader, try out our 2-week free trial to trade alongside our pros and get access to our trades in real-time to help you trade gold online with success!